Session Information
Date: Wednesday, June 7, 2017
Session Title: Neuroimaging (Non-PD)
Session Time: 1:15pm-2:45pm
Location: Exhibit Hall C
Objective: To identify specific metabolic brain networks for parkinsonian (MSA-P) and cerebellar (MSA-C) variants of MSA.
Background: MSA is associated with a disease-related metabolic brain network (MSARP) based on 18F-FDG PET (1). Network activity of MSARP was elevated in MSA patients relative to healthy controls and PD patients and correlated with clinical indices, suggesting that this network marker can assist in differential diagnosis of parkinsonism and assess the disease severity. However, the previous studies included patients mostly with MSA-P and also with MSA-C. It remains not known whether any unique brain network can characterize each of these two clinical subtypes of MSA.
Methods: 16 Chinese patients with MSA-P (10M/6F, age 59.6 ± 8.2y), 16 MSA-C (12M/4F, age 57.3 ± 6.7y) together with 16 PD (12M/4F, age 58.4 ± 4.5y), 16 PSP (12M/4F, age 62.9 ± 9.0y) and 16 healthy controls (6M/10F, age 58.7 ± 4.6y) underwent FDG PET imaging. MSAPRP and MSACRP were identified in the combined patients and controls by applying SSM/PCA toolbox (2). Network expression in each PET scan was computed for all groups using a voxel-based network quantification algorithm and represented by a Z-score based on subject scores of the controls.
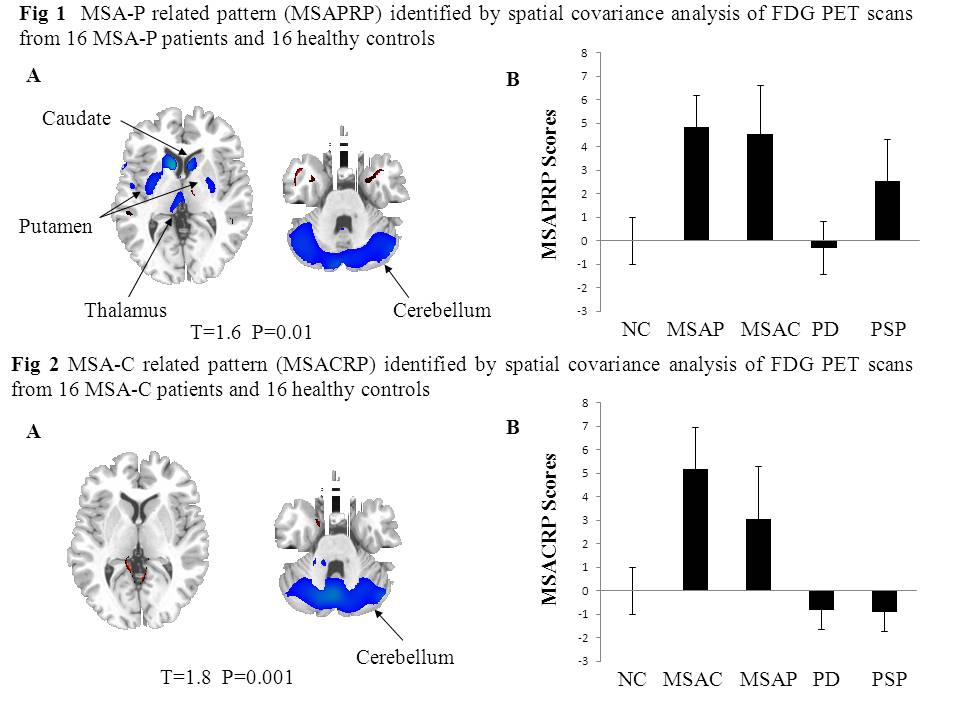
Results: For MSA-P patients and controls, the first 4 PCs accounted for 55% of subject × voxel variance. The linear combination of all these PCs produced a MSAP-related pattern (MSAPRP), which was characterized by metabolic decreases in the bilateral caudate, putamen and cerebellum and in the left thalamus (Fig. 1). Relative to the controls MSAPRP scores were elevated (P<0.0001) similarly in MSA-P and MSA-C patients but not in PD patients (P=0.42). MSAPRP scores were elevated (P<0.0001) in PSP patients but lower (P<0.01) than in both MSA subtypes. For the MSA-C patients and controls, the first 3 PCs accounted for 54% of subject × voxel variance. The linear combination of PC1 and PC3 produced a MSAC-related pattern (MSACRP), which was characterized by bilateral metabolic decreases in the cerebellum (Fig. 2). Compared to the controls MSACRP scores were elevated (P<0.0001) in both MSA-C and MSA-P patients but decreased in both PD and PSP patients (P<0.02). MSACRP scores were lower (P<0.01) in MSA-P than in MSA-C patients.
Conclusions: The specific metabolic brain networks corresponding to MSA-P and MSA-C may be helpful in further improving differential diagnosis of parkinsonism.
References: 1. Poston, KL (2012) Network correlates of disease severity in multiple system atrophy. Neurology 78: 1237-1244.
2. Peng, S (2014). Characterization of disease-related covariance topographies with SSMPCA toolbox: effects of spatial normalization and PET scanners. Hum Brain Mapp 35: 1801-14.
To cite this abstract in AMA style:
P. Wu, S. Peng, J. Wang, J. Wu, C. Jiang, J. Ge, D. Eidelberg, Y. Ma, C. Zuo. Specific Metabolic Brain Networks Associated with Parkinsonian and Cerebellar Variants of Multiple System Atrophy [abstract]. Mov Disord. 2017; 32 (suppl 2). https://www.mdsabstracts.org/abstract/specific-metabolic-brain-networks-associated-with-parkinsonian-and-cerebellar-variants-of-multiple-system-atrophy/. Accessed April 20, 2025.« Back to 2017 International Congress
MDS Abstracts - https://www.mdsabstracts.org/abstract/specific-metabolic-brain-networks-associated-with-parkinsonian-and-cerebellar-variants-of-multiple-system-atrophy/

