Category: Parkinson's Disease: Neuroimaging
Objective: Identifying novel biomarkers to predict disease progression is of paramount importance in patients with Parkinson’s disease (PD). In this study, we utilized Structural Magnetic Resonance Imaging (sMRI)-based multivariate summary score of gray matter volume (GMV) using Mahalanobis distance (MD) to capture the GMV heterogeneity in individual patients and (1) examined whether MD of GMV (MGMV) could predict the rate of progression of motor symptoms, and (2) investigated the changes in MGMV over time.
Background: Longitudinal sMRI studies have reported GMV abnormalities in widespread brain regions and were associated with disease progression in PD[1]. A metric that summarizes the GMV heterogeneity from multiple brain regions into a single score, to predict motor severity and its longitudinal changes has not yet been explored in PD.
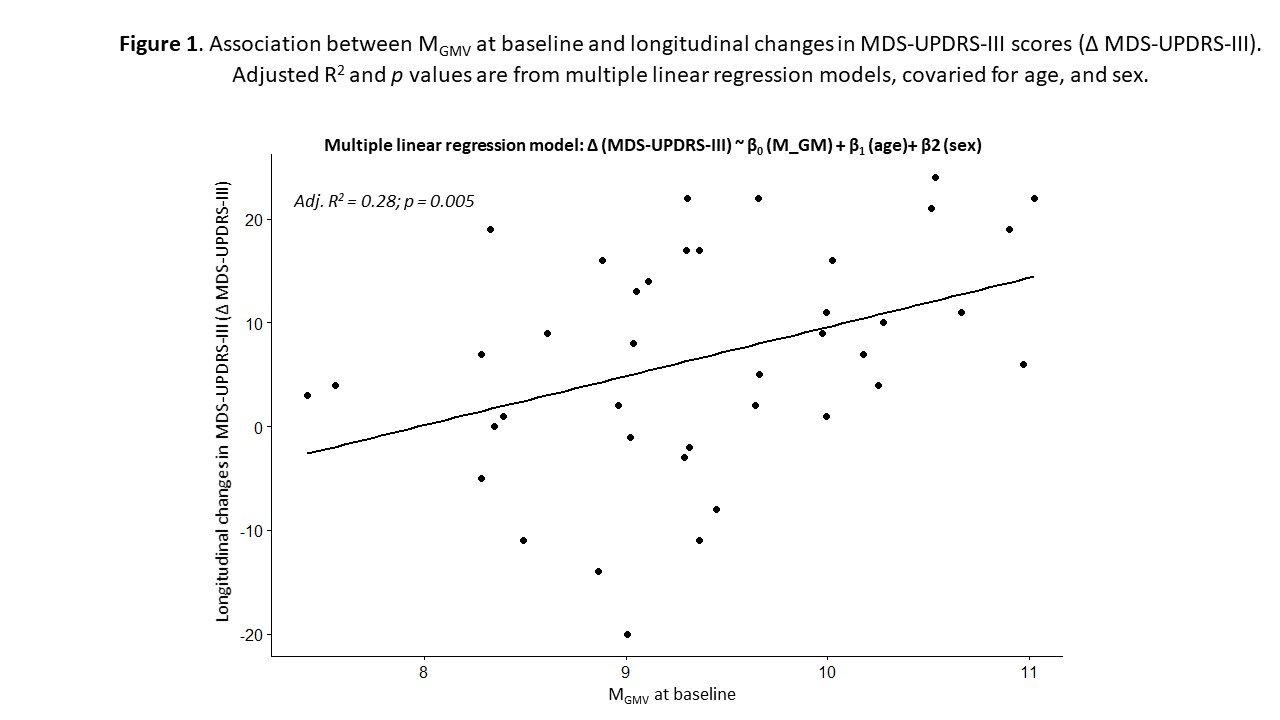
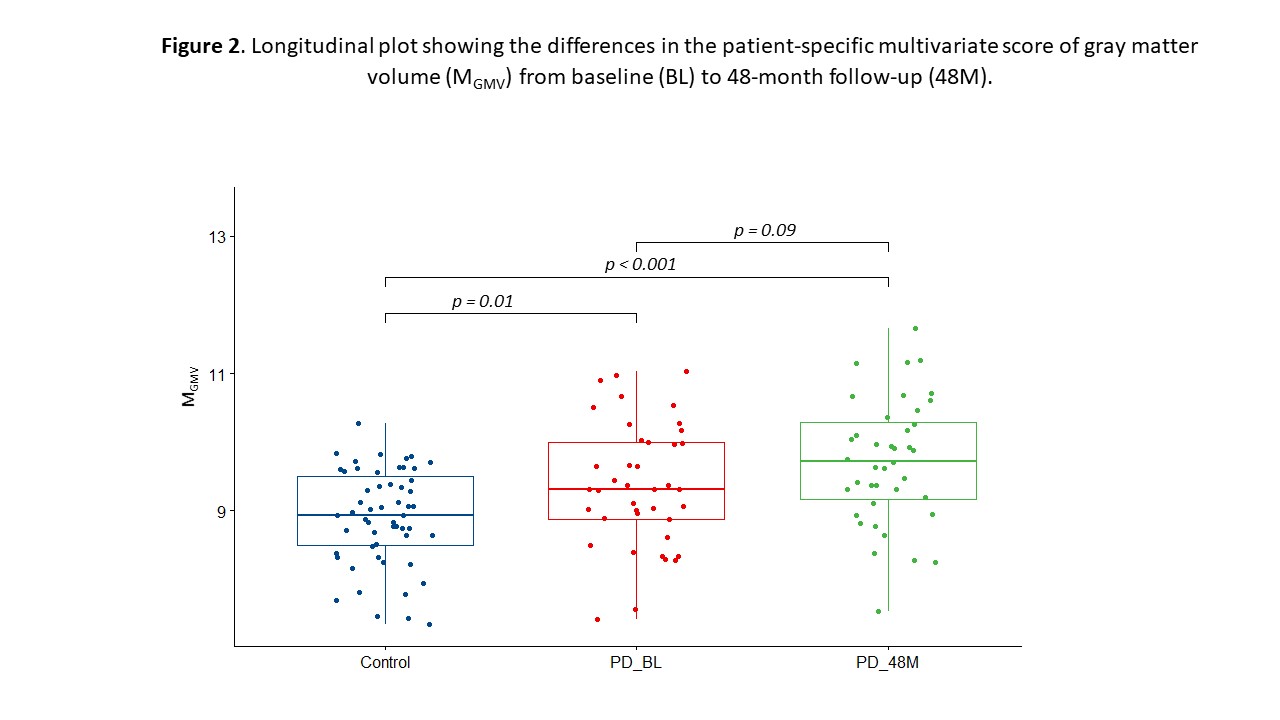
Method: sMRI (T1-weighted MRI) and clinical motor scores (MDS-UPDRS-III; medication OFF) data were obtained from the Parkinson’s Progression Markers Initiative database (www.ppmi-info.org/data); for 40 PD patients with sMRI at both baseline (BL) and 48-month follow-up (48M), and 55 healthy controls (HC) at BL only [table 1]. GMV was calculated from 86 regions of interest (ROIs) using Hammers atlas[2] in Computational Anatomy Toolbox (CAT12, http://dbm.neuro.uni-jena.de/cat/). Later, GMV was divided by total intracranial volume of each participant to obtain normalized GMV (GMVN) and derived a subject-specific summary score of GMVN using MD defined as MGMV = √(s-µ)τ .C-1.(s-µ), where, s represents a vector of subject GMVN in each ROI, µ the average GMVN calculated from HC, and C a covariance matrix between ROIs across the control population. We tested whether MGMV could predict changes in motor severity, measured by ∆ MDS-UPDRS-III using multiple linear regression, ∆ denotes the changes in the MDS-UPDRS-III scores from BL to 48M. To assess the changes in MGMV over time, we conducted linear mixed-effect model.
Results: MGMV at BL significantly predicted changes in motor severity (β = 4.99; adjusted R2= 0.28; p = 0.005) [figure 1]. Longitudinal analyses from BL to 48M showed a tendency of increased MGMV over time, however, it was not significant (β = 0.11; p = 0.09) [figure 2].
Conclusion: In conclusion, we identified an imaging biomarker based on a patient-specific summary score of gray matter volume to predict long-term motor outcomes in patients with PD.
References: [1] E. Sarasso, F. Agosta, N. Piramide, M. Filippi, Progression of grey and white matter brain damage in Parkinson’s disease: a critical review of structural MRI literature, J. Neurol. 268 (2021) 3144–3179.
[2] A. Hammers, R. Allom, M.J. Koepp, S.L. Free, R. Myers, L. Lemieux, T.N. Mitchell, D.J. Brooks, J.S. Duncan, Three-dimensional maximum probability atlas of the human brain, with particular reference to the temporal lobe, Hum. Brain Mapp. 19 (2003) 224–247.
To cite this abstract in AMA style:
A. Vijayakumari, H. Fernandez, B. Walter. Patient-specific multivariate gray matter volumetric distance to predict disease severity in Parkinson’s disease [abstract]. Mov Disord. 2022; 37 (suppl 2). https://www.mdsabstracts.org/abstract/patient-specific-multivariate-gray-matter-volumetric-distance-to-predict-disease-severity-in-parkinsons-disease/. Accessed April 18, 2025.« Back to 2022 International Congress
MDS Abstracts - https://www.mdsabstracts.org/abstract/patient-specific-multivariate-gray-matter-volumetric-distance-to-predict-disease-severity-in-parkinsons-disease/


