Category: Parkinson's Disease: Neuroimaging
Objective: To explore changes in the organization and functionality of the olfactory network in patients with Parkinson’s Disease (PD) using graph theory-based network analysis on resting-state fMRI (rs-fMRI) data.
Background: Hyposmia is a well-established and early non-motor symptom of PD. Research has suggested its role as a potential biomarker of PD progression. While the architecture of the human olfactory network (OlfN) has been recently described in the literature,1 it is not fully understood how olfactory dysfunction in PD is reflected in the OlfN.
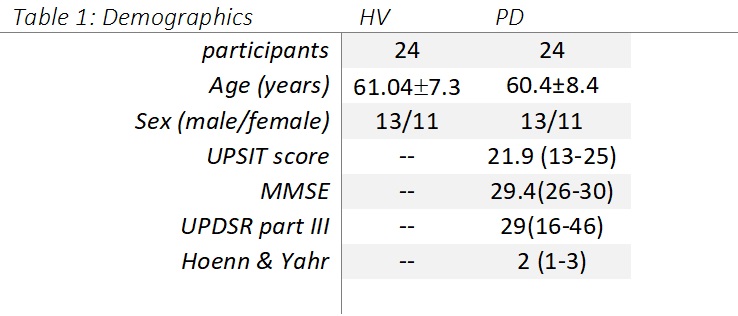
Method: We collected structural MR images and 6-min eye closed rs-fMRI from 24 PD subjects (PDs) in the off-medication state and 24 age/sex matched healthy volunteers (HVs) in a 3T GE MR750 scanner. We administered the University of Pennsylvania Smell Identification Test (UPSIT) to measure olfactory function. (Table 1)
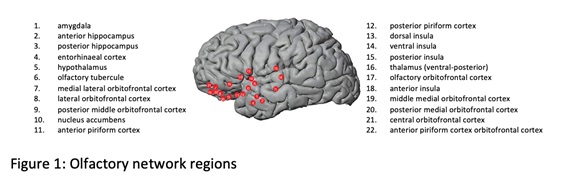
MRI data was preprocessed in AFNI.2 For each subject, we used the AAL627 atlas1 to compute time series of ROIs and assign correlations to a thresholded graph1 of 22×22 (Fig.1). The Python version of the Brain Connectivity Toolbox3 was used to calculate graph metrics. Statsmodels4 was used to create 1-way ANOVA models, with G, the global functional correlation, as a covariate. We fit linear regression models to predict UPSIT values using global efficiency of the OlfN. We used an occipital network (OccN) as control. As part of the model, we ran a statistical test to see if coefficients to the exogenous variables were significantly above zero.
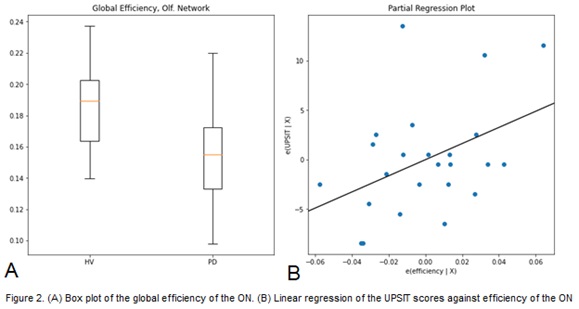
Results: Global efficiency of the OlfN is significantly impacted in PD (p=4e-4) (Fig 2A), although including G as a covariate reduces significance to p=0.068. In comparison, the OccN has p=0.01, which becomes nonsignificant (p>0.05) when G is included as a covariate. Linearly regressing UPSIT scores against efficiency of the OlfN yields r2=0.178 (p=0.04) (Fig 2B), compared to r2=0.03 for the OccN. Models including age, sex and disease duration did not reduce Akaike information criterion, suggesting they do not explain variability in UPSIT scores as well as the univariate model with efficiency.
Conclusion: PD patients have a less efficient OlfN, greater than the extent of the deficits observed in other networks. These changes correlate with olfactory dysfunction and might help evaluation of non-motor changes in PD.
References: 1. Arnold TC, You Y, Ding M, Zuo X-N, Araujo I de, Li W. Functional Connectome Analyses Reveal the Human Olfactory Network Organization. eNeuro. 2020;7(4). doi:10.1523/ENEURO.0551-19.2020
2. Cox, R. (1996). AFNI: Software for Analysis and Visualization of Functional Magnetic Resonance Neuroimages. Computers and Biomedical Research, 29, 162-173.
3. Rubinov M, Sporns O. Complex network measures of brain connectivity: Uses and interpretations. NeuroImage. 2010;52(3):1059-1069. doi:https://doi.org/10.1016/j.neuroimage.2009.10.003
4. Seabold S, Perktold J. statsmodels: Econometric and statistical modeling with python. In: 9th Python in Science Conference. ; 2010.
To cite this abstract in AMA style:
L. Pesantez Pacheco, M. Saqib, D. Ehrlich, M. Hallett, S. Horovitz. Olfactory Network Reorganization in Parkinson’s Disease [abstract]. Mov Disord. 2022; 37 (suppl 2). https://www.mdsabstracts.org/abstract/olfactory-network-reorganization-in-parkinsons-disease/. Accessed April 18, 2025.« Back to 2022 International Congress
MDS Abstracts - https://www.mdsabstracts.org/abstract/olfactory-network-reorganization-in-parkinsons-disease/


