Objective: The main diagnostic challenge of drug resistant epilepsies is to find epileptogenic zone, which will be enough to remove to reach seizure freedom. These regions(called the Epileptogenic zone (EZ)(1)must be thus precisely defined from anatomo-electro-clinical observations obtained during pre-surgical evaluation. In a large number of cases, this evaluation involves invasive EEG recordings, in particular stereo-electroencephalography(SEEG)(2,3,4).Most of the existing machine methods focus on seizures with fast activity in the onset.Our aim was to create new tool that help recognize epileptogenic zone through all types of seizure onset patterns from stereo-EEG signals.
Background: Defining the EZ from SEEG can be challenging (5).EZ is increasingly recognized as a network of hyperexcitable connected regions generating seizures and secondary leading to ictal spreading in propagation networks (6).In 75% of cases,the seizure onset patterns involve high frequencies, most often in the high beta or gamma band(7,8).Methods for quantifying the EZ have been developed over the past years in order to complement the SEEG interpretation (for review see(9,6).Most of these methods are based on the detection/mapping of high frequencies, they are inefficient to detect slower patterns of onset that account for 20-30% of commonly observed SEEG patterns(10, 8). In this context, other methods based on functional connectivity have been proposed to study focal seizures onset from intracranial recordings(11,12,13,14,15).
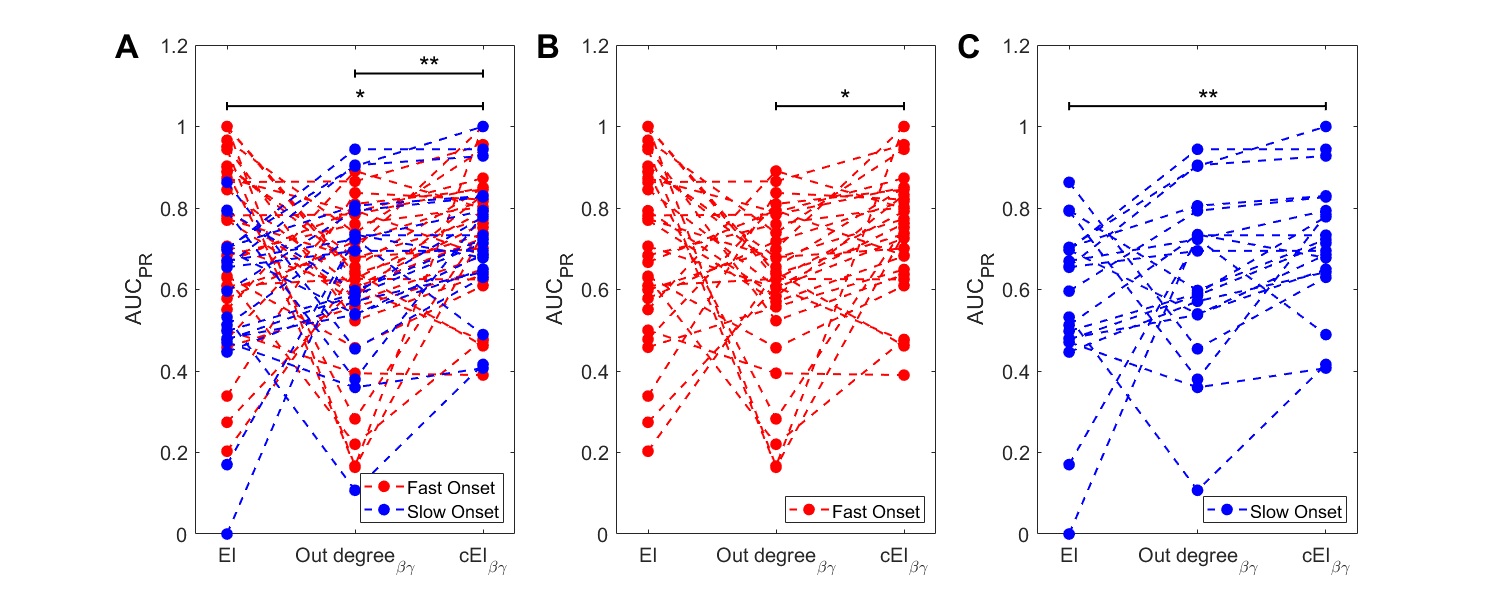
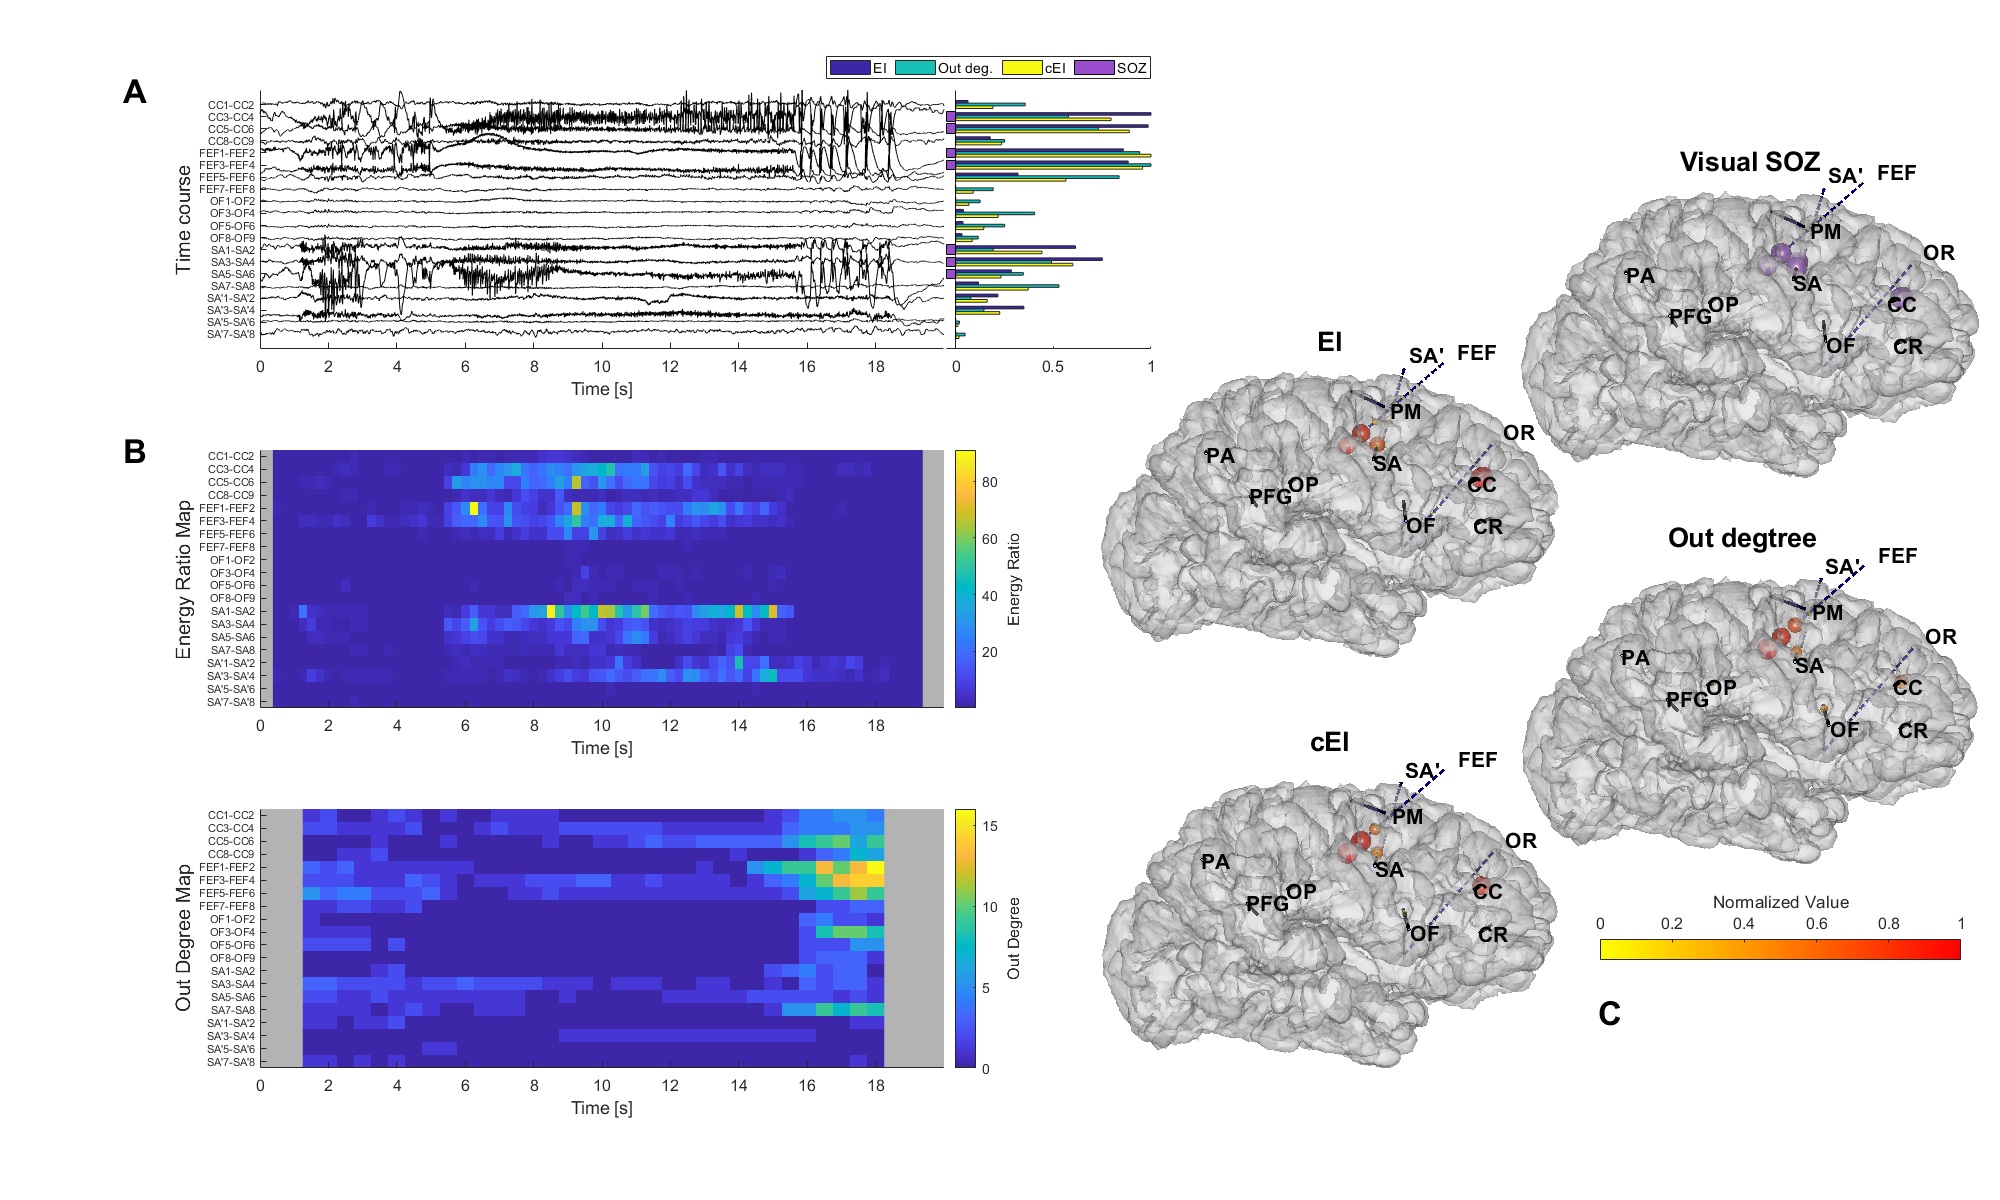
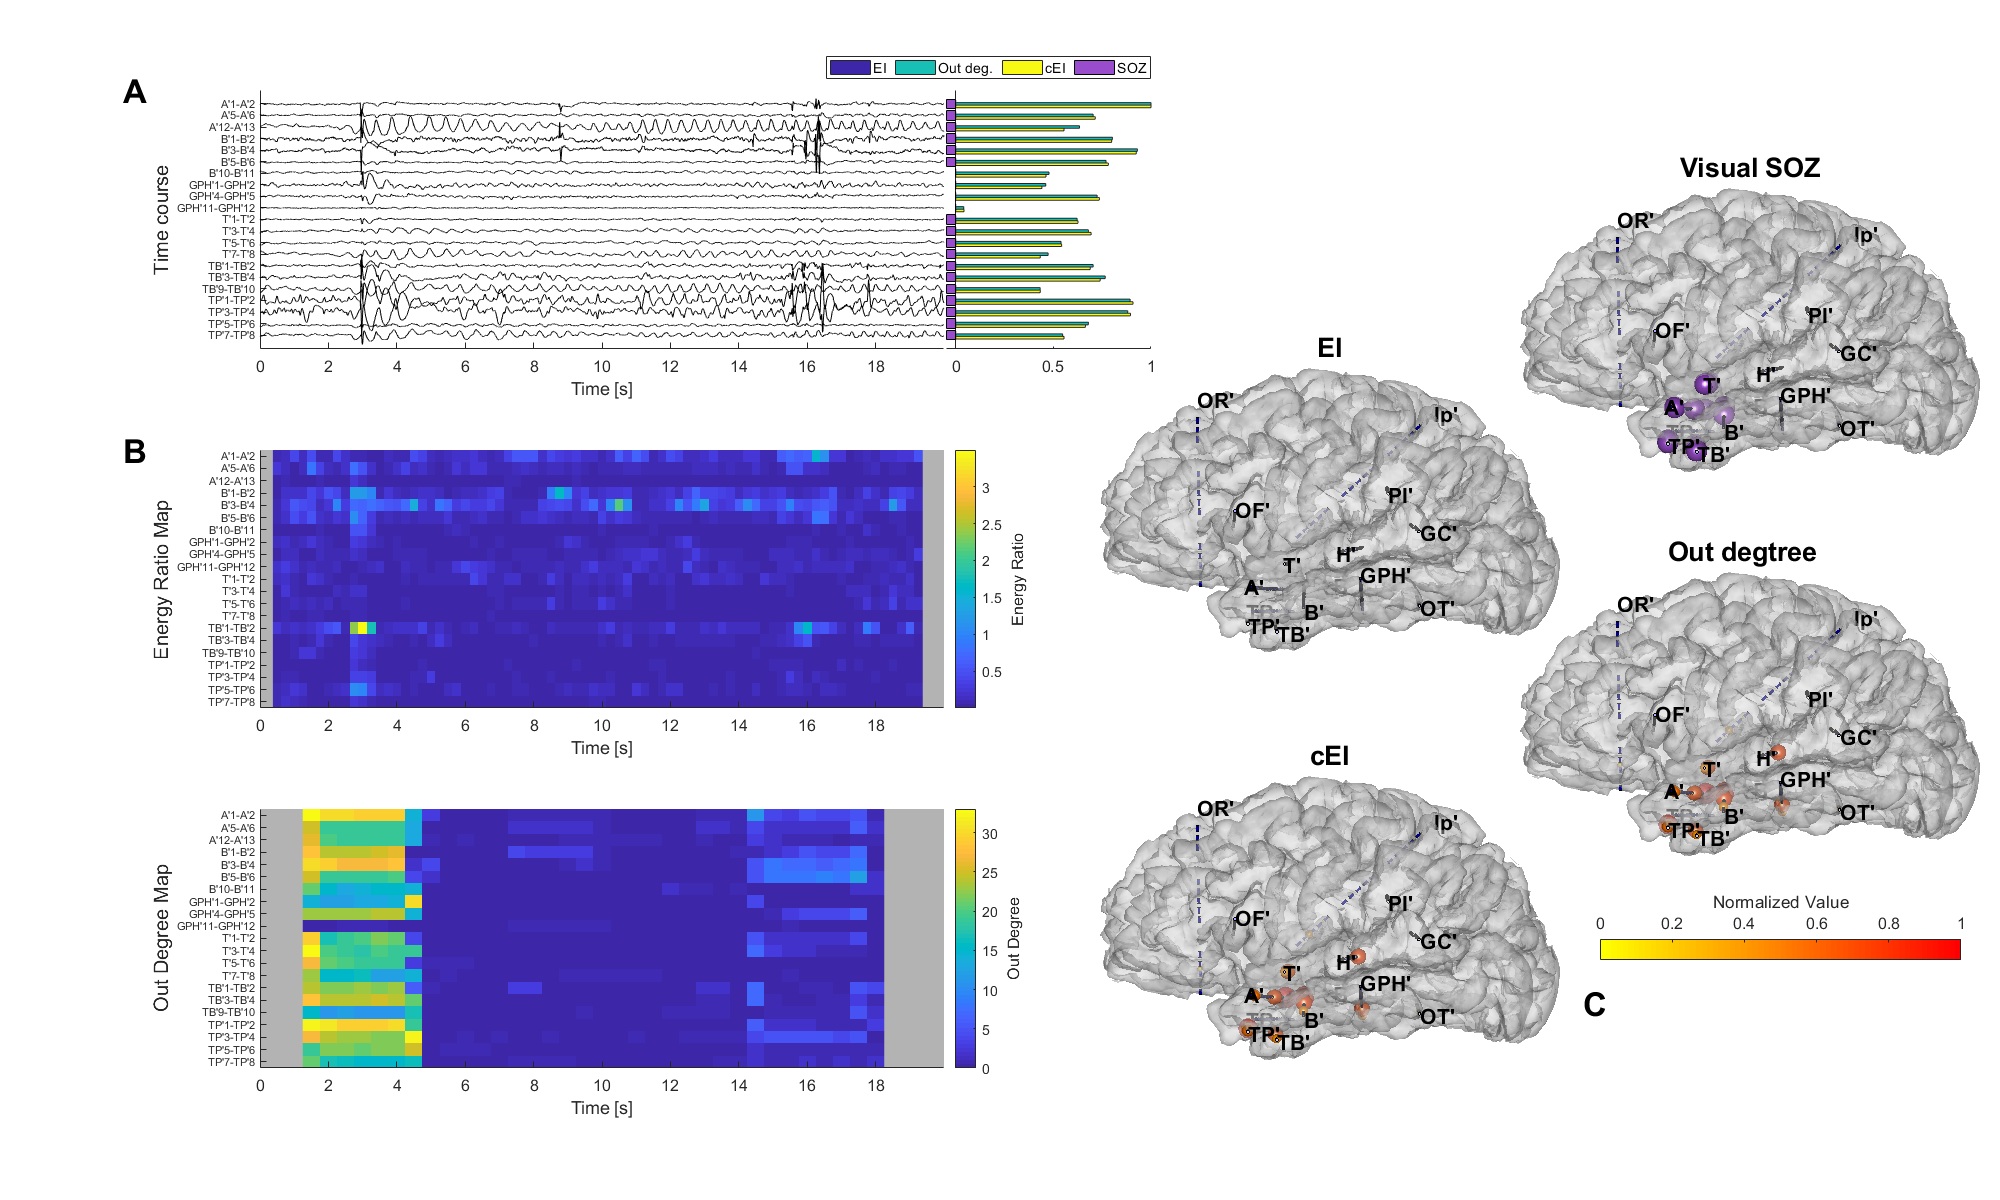
Method: We studied seizures from 51 patients, suffering from focal drug-resistant epilepsy associated with malformation of cortical development. We separated seizure onset patterns to slow and fast. We quantified combined epileptogenicity index (cEI), based on a directed connectivity measure (“out-degrees”) and the classical epileptogenicity index (EI). The results were compared with seizure onset zone (SOZ), detected visually. The quality of the detector was quantified by the area under the precision-recall curve. To test differences between measures was used the Friedman test with Bonferroni correction.
Results: cEI showed the best concordance with visual SOZ in both (slow and fast) groups.
Conclusion: cEI may help epileptologist to delineate SOZ in a complex epileptogenic network. As cEI include the very beginning of fast activity during seizure onset and ictal changes in the epileptogenic network.
References: 1. Bancaud J. Surgery of epilepsy based on stereotactic investigations–the plan of the SEEG investigation. Acta Neurochir Suppl (Wien). 1980;30:25-34. 2. Bancaud J, Talairach J. La stéréo-électroencéphalographie dans l’épilepsie: informations neurophysiopathologiques apportées par l’investigation fonctionnelle stéreotaxique. Paris: Masson et Cie; 1965. 3. Cardinale F, Casaceli G, Raneri F, Miller J, Lo Russo G. Implantation of Stereoelectroencephalography Electrodes: A Systematic Review. J Clin Neurophysiol. 2016;33:490–502. 4. Isnard J, Taussig D, Bartolomei F, Bourdillon P, Catenoix H, Chassoux F, et al. French guidelines on stereoelectroencephalography (SEEG). Neurophysiol Clin. 2018;48:5-13. 5. Bartolomei F, Nica A, Valenti-Hirsch MP, Adam C, Denuelle M. Interpretation of SEEG recordings. Neurophysiologie clinique = Clinical neurophysiology. 2018;48:53-7. 6. Bartolomei F, Lagarde S, Wendling F, McGonigal A, Jirsa V, Guye M, et al. Defining epileptogenic networks: Contribution of SEEG and signal analysis. Epilepsia. 2017;58:1131-47. 7. Perucca P, Dubeau F, Gotman J. Intracranial electroencephalographic seizure-onset patterns: effect of underlying pathology. Brain. 2014;137:183-96. 8. Lagarde S, Buzori S, Trebuchon A, Carron R, Scavarda D, Milh M, et al. The repertoire of seizure onset patterns in human focal epilepsies: Determinants and prognostic values. Epilepsia. 2019;60:85-95. 9. Andrzejak RG, David O, Gnatkovsky V, Wendling F, Bartolomei F, Francione S, et al. Localization of Epileptogenic Zone on Pre-surgical Intracranial EEG Recordings: Toward a Validation of Quantitative Signal Analysis Approaches. Brain topography. 2015;28:832-7. 10. Singh S, Sandy S, Wiebe S. Ictal onset on intracranial EEG: Do we know it when we see it? State of the evidence. Epilepsia. 2015;56:1629-38. 11. van Mierlo P, Carrette E, Hallez H, Raedt R, Meurs A, Vandenberghe S, et al. Ictal-onset localization through connectivity analysis of intracranial EEG signals in patients with refractory epilepsy. Epilepsia. 2013;54:1409-18. 12. Courtens S, Colombet B, Trebuchon A, Brovelli A, Bartolomei F, Benar CG. Graph Measures of Node Strength for Characterizing Preictal Synchrony in Partial Epilepsy. Brain connectivity. 2016;6:530-9. 13. Varotto G, Tassi L, Franceschetti S, Spreafico R, Panzica F. Epileptogenic networks of type II focal cortical dysplasia: a stereo-EEG study. NeuroImage. 2012;61:591-8. 14. Proix T, Bartolomei F, Chauvel P, Bernard C, Jirsa VK. Permittivity coupling across brain regions determines seizure recruitment in partial epilepsy. The Journal of neuroscience : the official journal of the Society for Neuroscience. 2014;34:15009-21. 15. Hebbink J, Meijer H, Huiskamp G, van Gils S, Leijten F. Phenomenological network models: Lessons for epilepsy surgery. Epilepsia. 2017:147–51.
To cite this abstract in AMA style:
A. Balatskaya. New tool to localize seizure onset zone from sEEG signal-connectivity epileptogenicity index [abstract]. Mov Disord. 2020; 35 (suppl 1). https://www.mdsabstracts.org/abstract/new-tool-to-localize-seizure-onset-zone-from-seeg-signal-connectivity-epileptogenicity-index/. Accessed April 21, 2025.« Back to MDS Virtual Congress 2020
MDS Abstracts - https://www.mdsabstracts.org/abstract/new-tool-to-localize-seizure-onset-zone-from-seeg-signal-connectivity-epileptogenicity-index/


