Category: Parkinson's Disease: Non-Motor Symptoms
Objective: Analyze multi-omics data from the PPMI cohort to identify molecular markers associated with self-reported gastrointestinal (GI) dysfunction in Parkinson’s disease (PD) patients.
Background: PD is a multi-system disease with a long prodromal phase featured by non-motor symptoms, including GI problems. Up to date, the molecular changes linked to GI dysfunctions remain unknown.
Method: We conducted longitudinal clustering to delineate trajectories of GI severity over five years using a k-means algorithm and CopyMean imputation in kml [1] and the SCOPA-AUT questionnaire and summing up the scales of Q1-7 as the GI severity from 1260 PD cases. Of the PD with genomics data, we classified high (n = 401) and low (n = 462) based on a cut-off point of distinguishing PD and control and performed a logistic regression including 5.9 million genetic variants (> 5% minor allele frequency) and covariates (sex, age at baseline, and disease duration) using PLINK2.0 [2]. We curated cerebrospinal fluid and urine proteomics, plasma metabolomics using limma [3], and blood transcriptome associated with high GI severity using DESeq2 [4]. We used an ordinal linear logistic regression to test the association of GI severity with UPDRS and MoCA assessments and linear regression to test the association with caudate thickness volume.
Results: We identified two clusters with different trajectories of GI progression (p = 0.0003, fig 1). The cluster with a high GI score has a higher proportion of LRRK2 carriers (p = 0.033), longer disease duration (p = 0.005), and older age at baseline (p = 0.0004). We identified a common variant in chromosome 10 associated with increased severity of GI symptoms (OR = 1.76; p = 9.5×10⁻⁸, fig 2). Individuals with elevated GI scores showed lower levels of PE, GalCer, and a-tocopherol metabolites (fig 3a) and down-regulation of IFI27, EREG, USP18, CCL2 and CCL8 transcripts (fig 3b). The high GI score is correlated with increased UPDRS-III (p = 0.06) and lower MoCA scores (p = 4.95×10⁻⁶), and higher CSF p-tau (p = 0.02) and a-beta levels (p = 0.01).
Conclusion: We uncovered genetic variations, metabolites, and genes associated with self-reported GI symptoms in PD patients. The progression of GI dysfunction aligns with motor and cognitive impairments. The integrative multi-omics approach uncovers novel molecular markers in PD patients with severe GI symptoms.
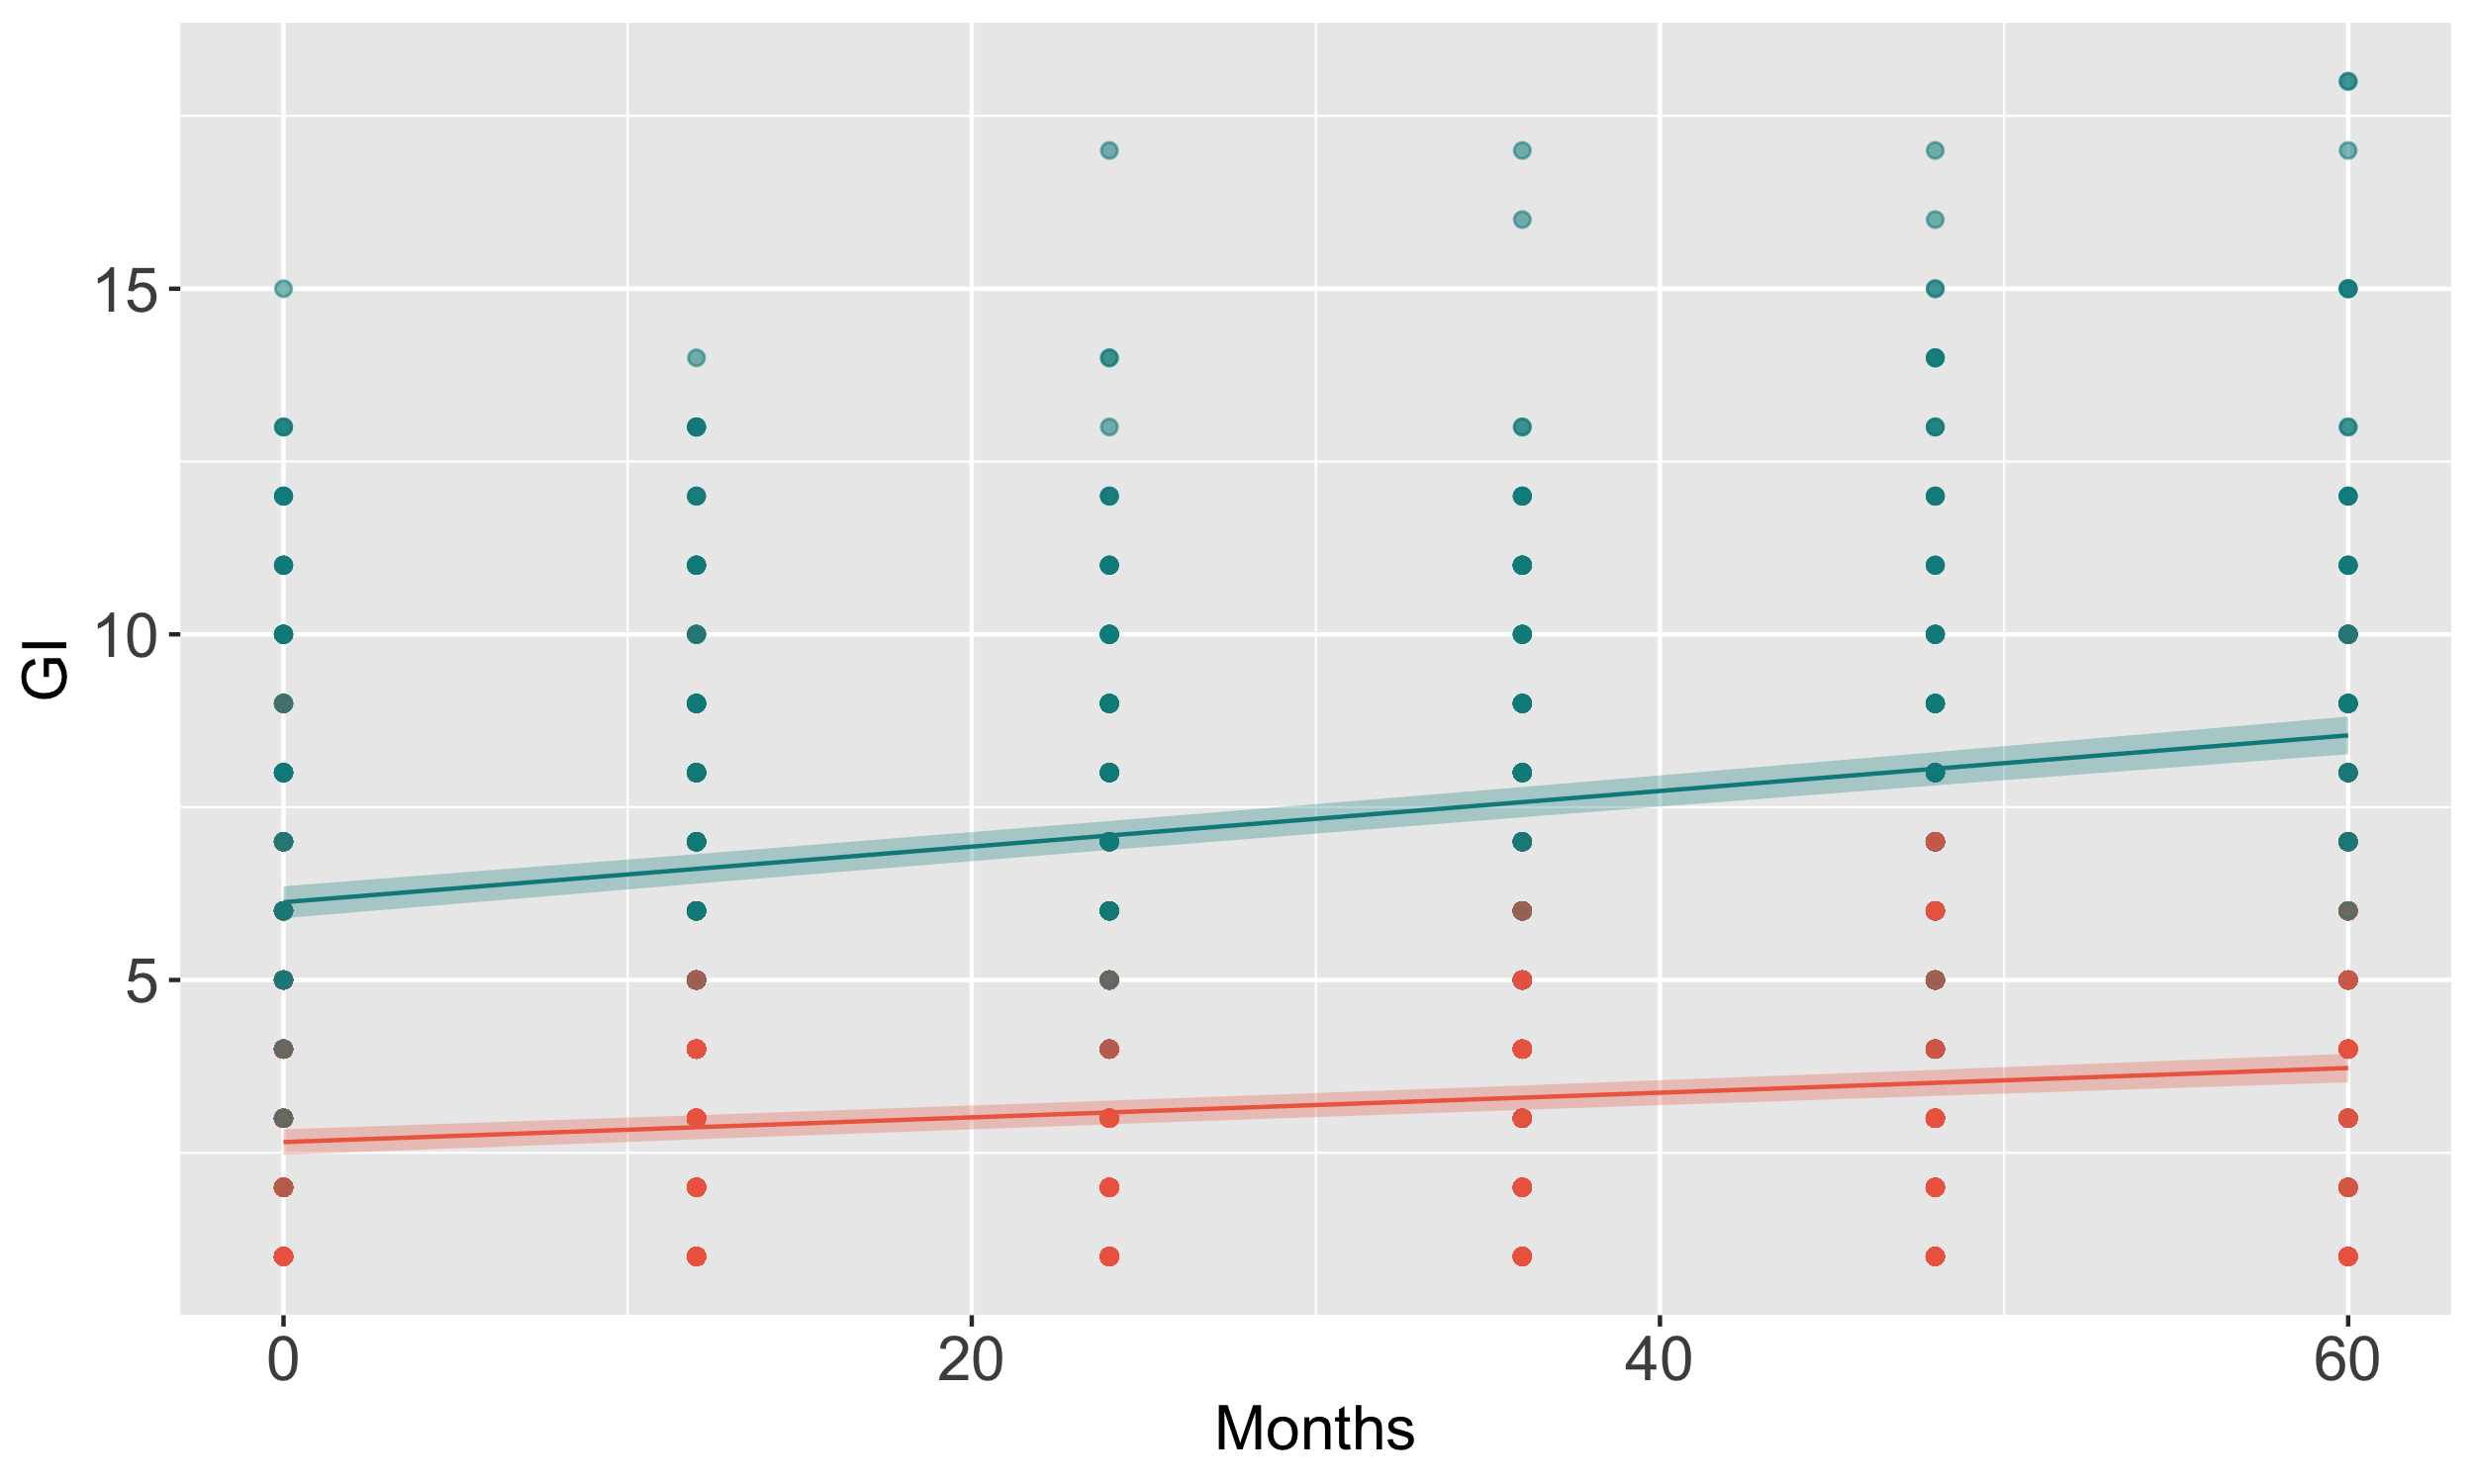
Longitudinal GI symptom scales over five years
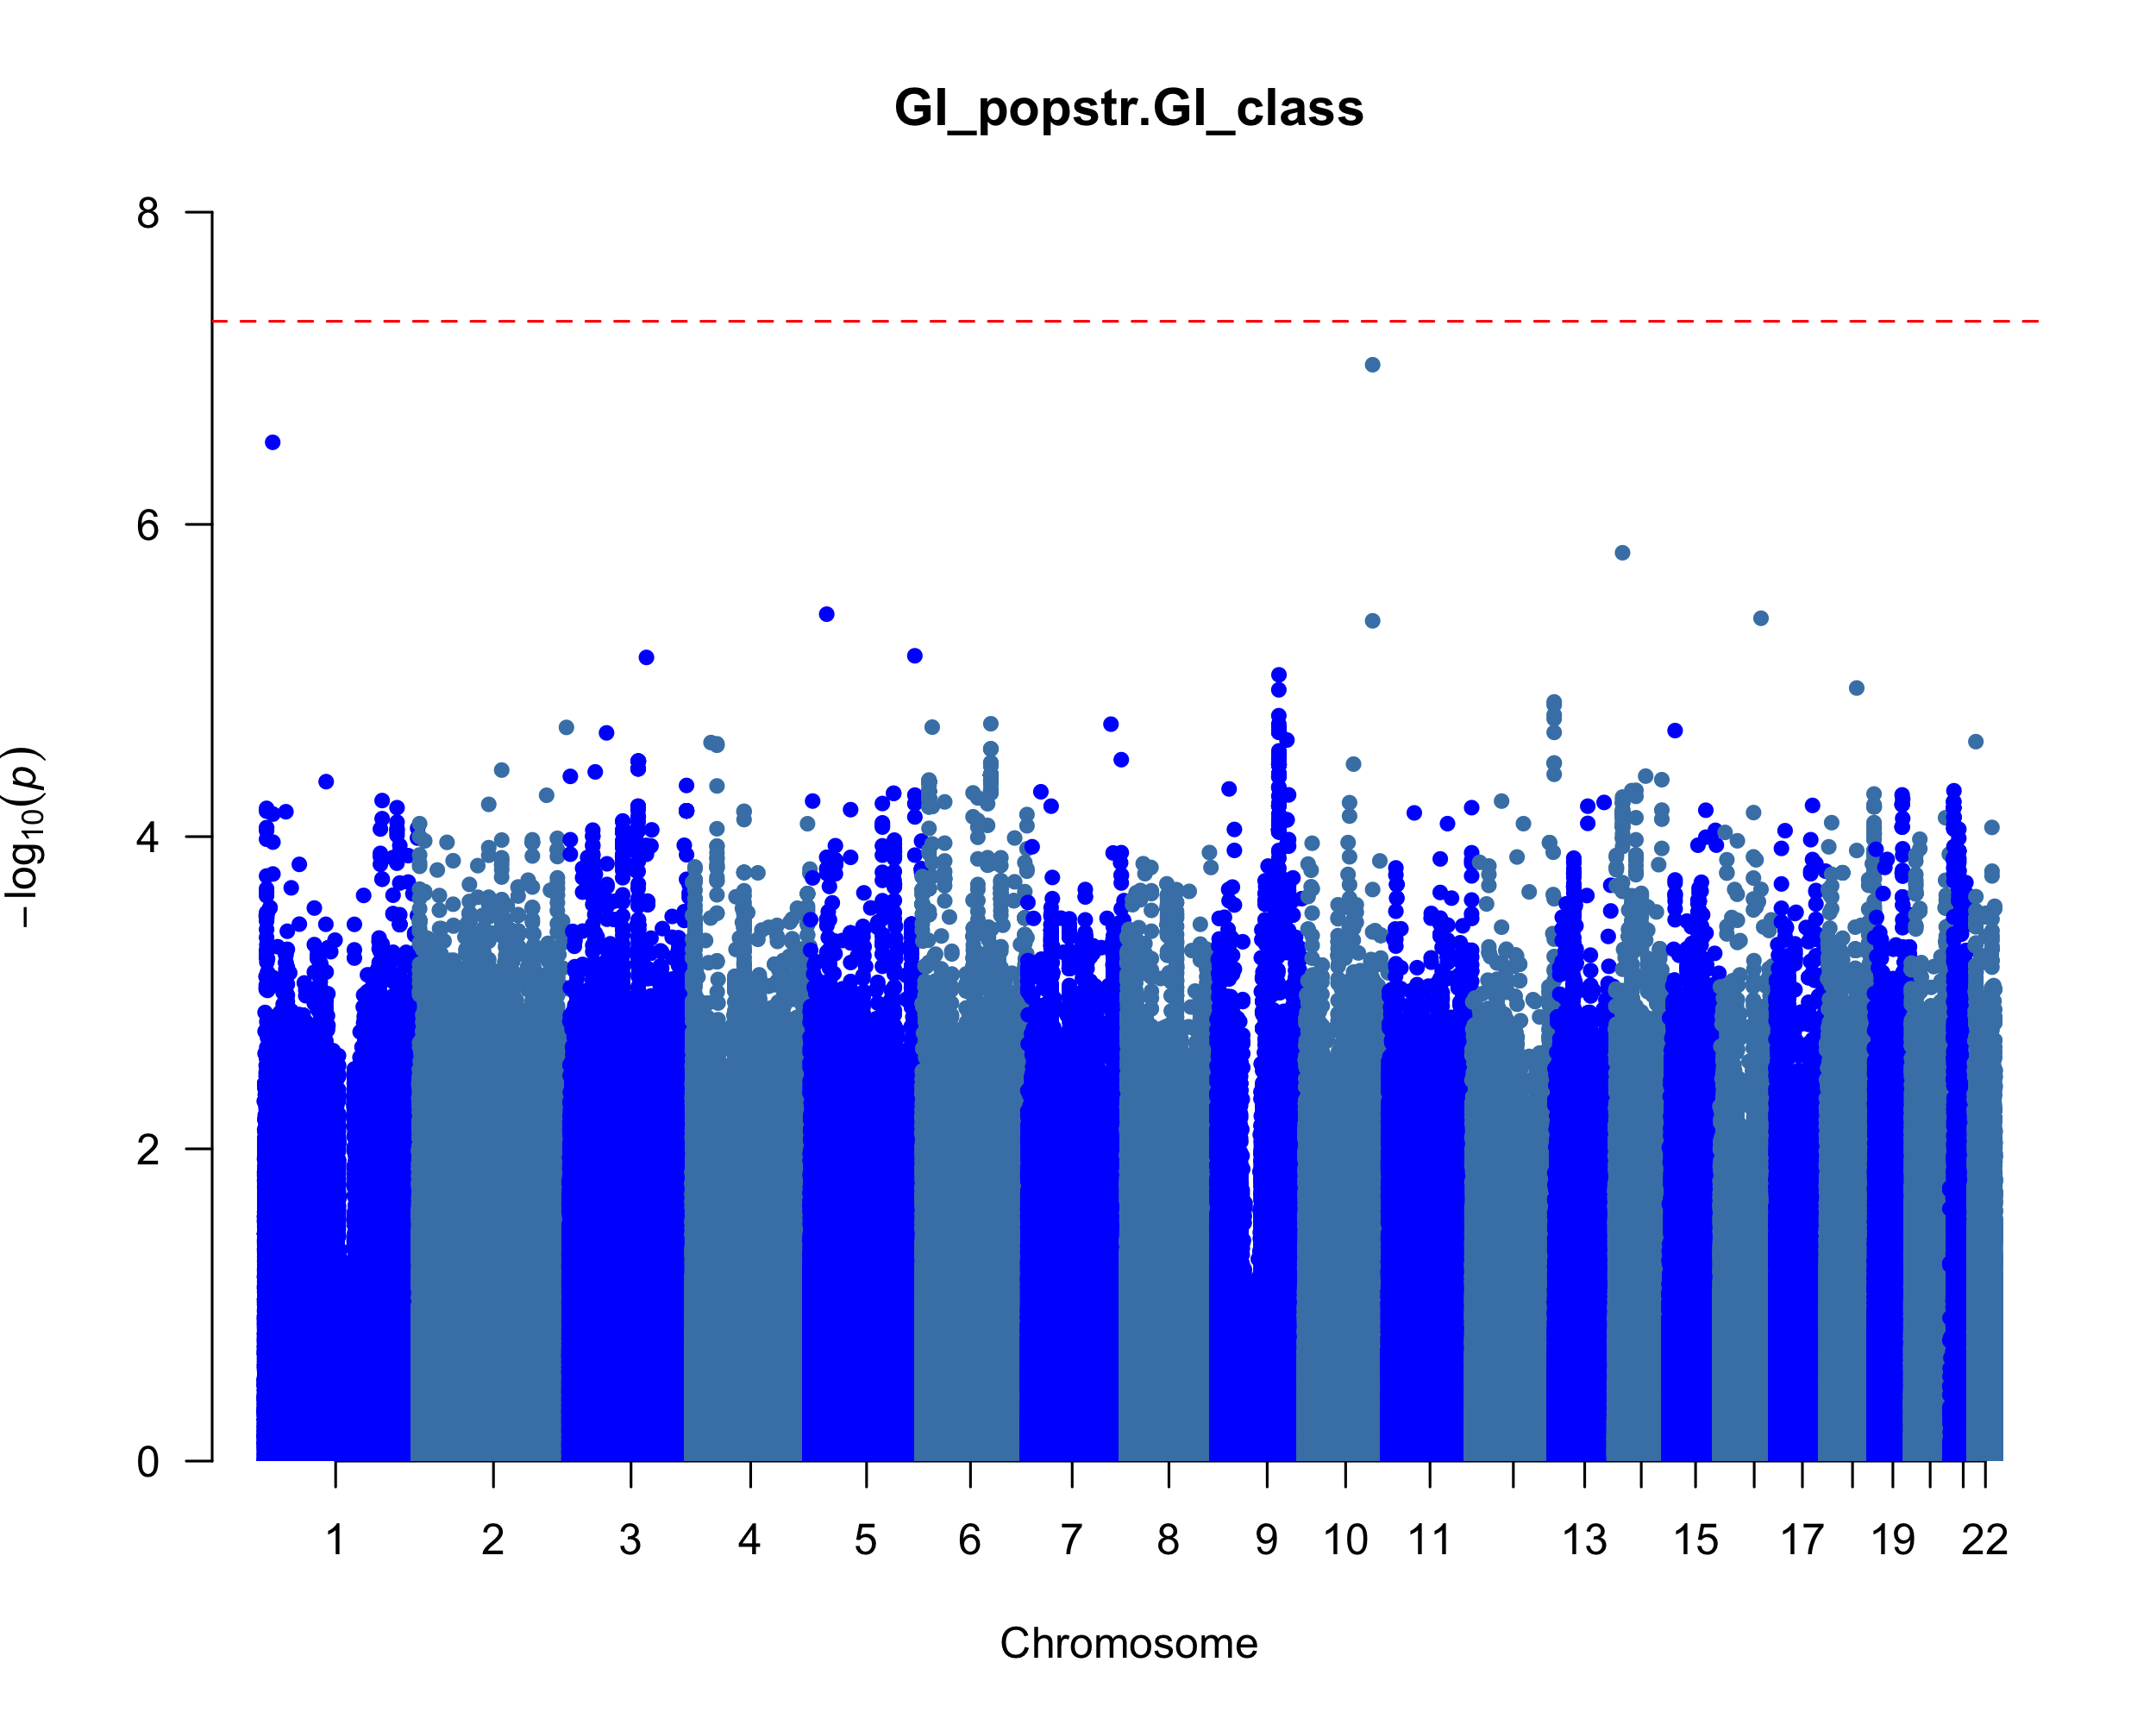
Manhattan plot of GWAS for GI
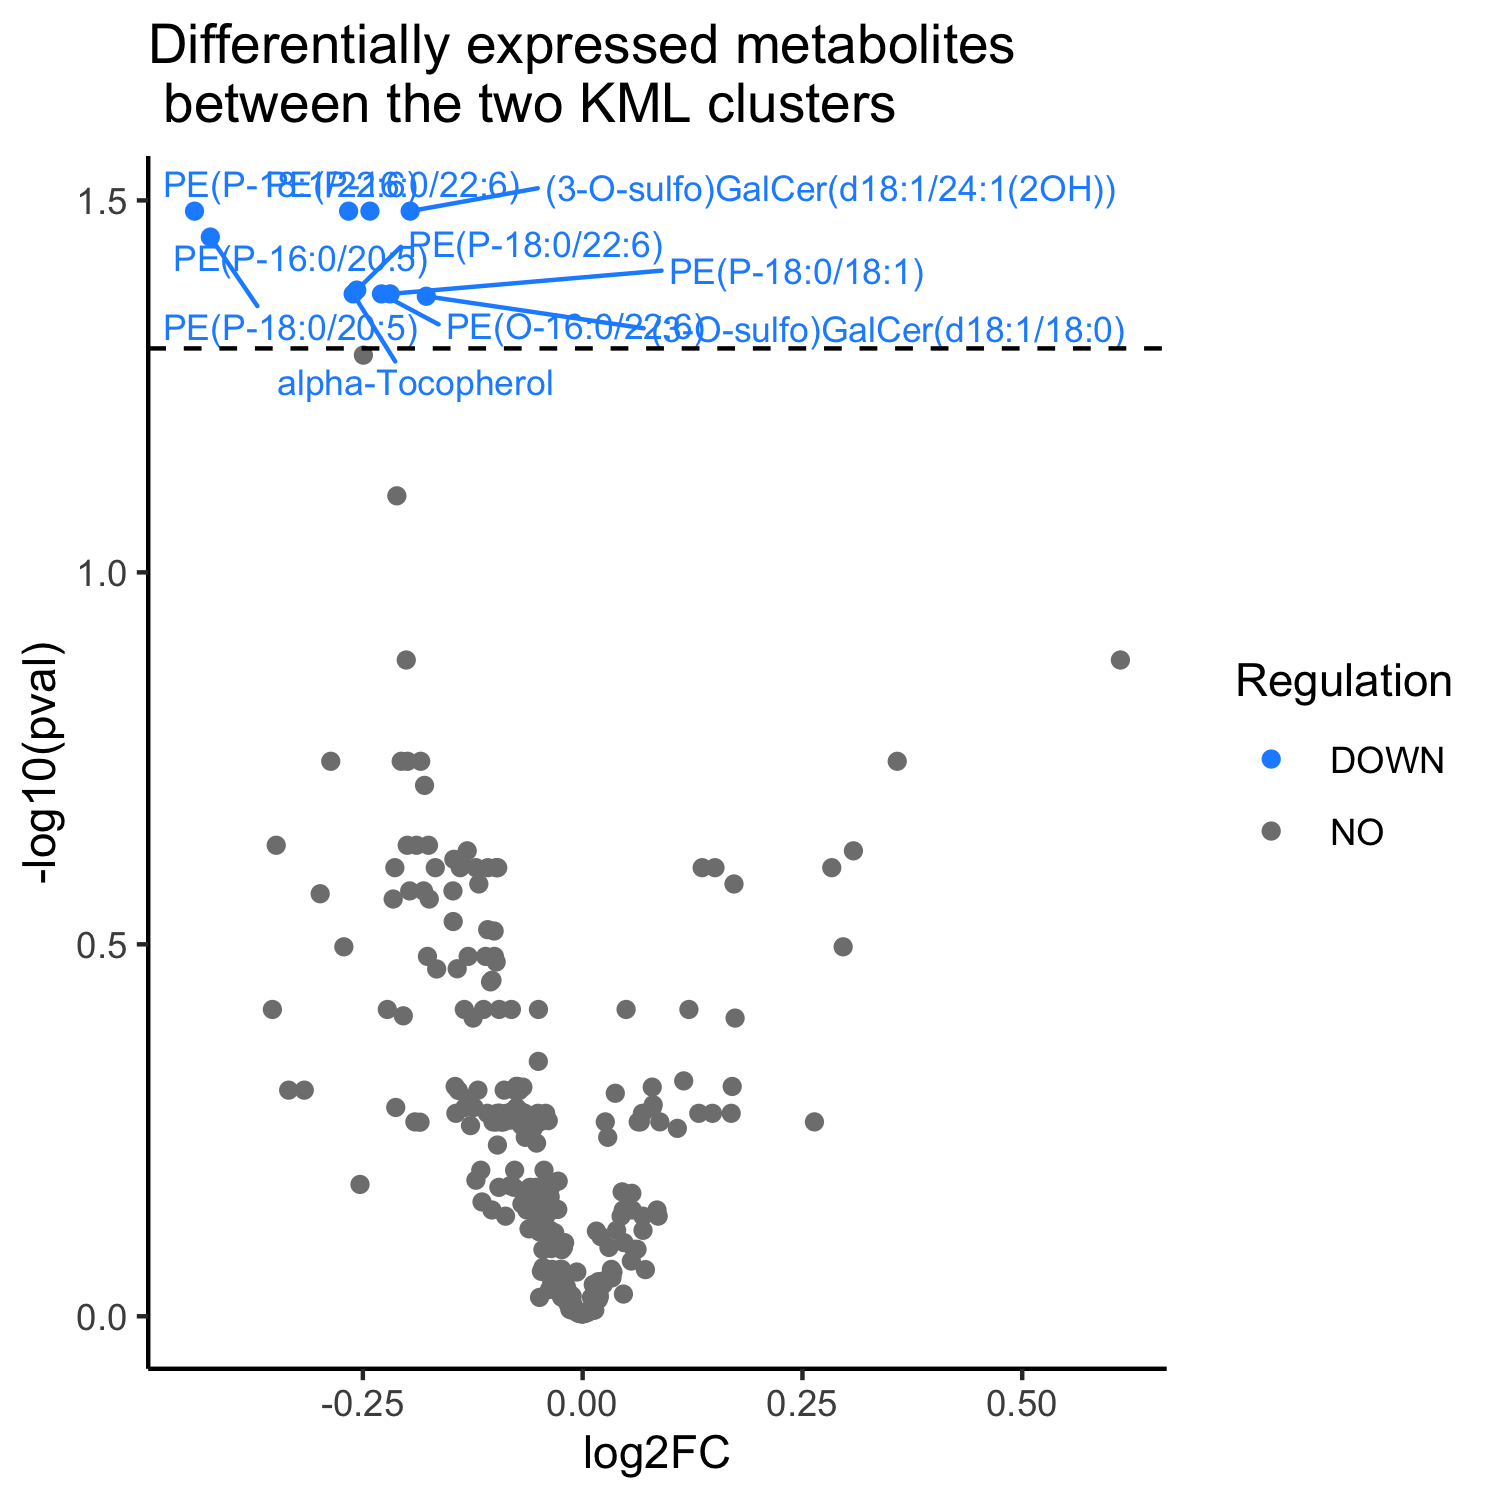
Volcano plot of dysregulated metabolites
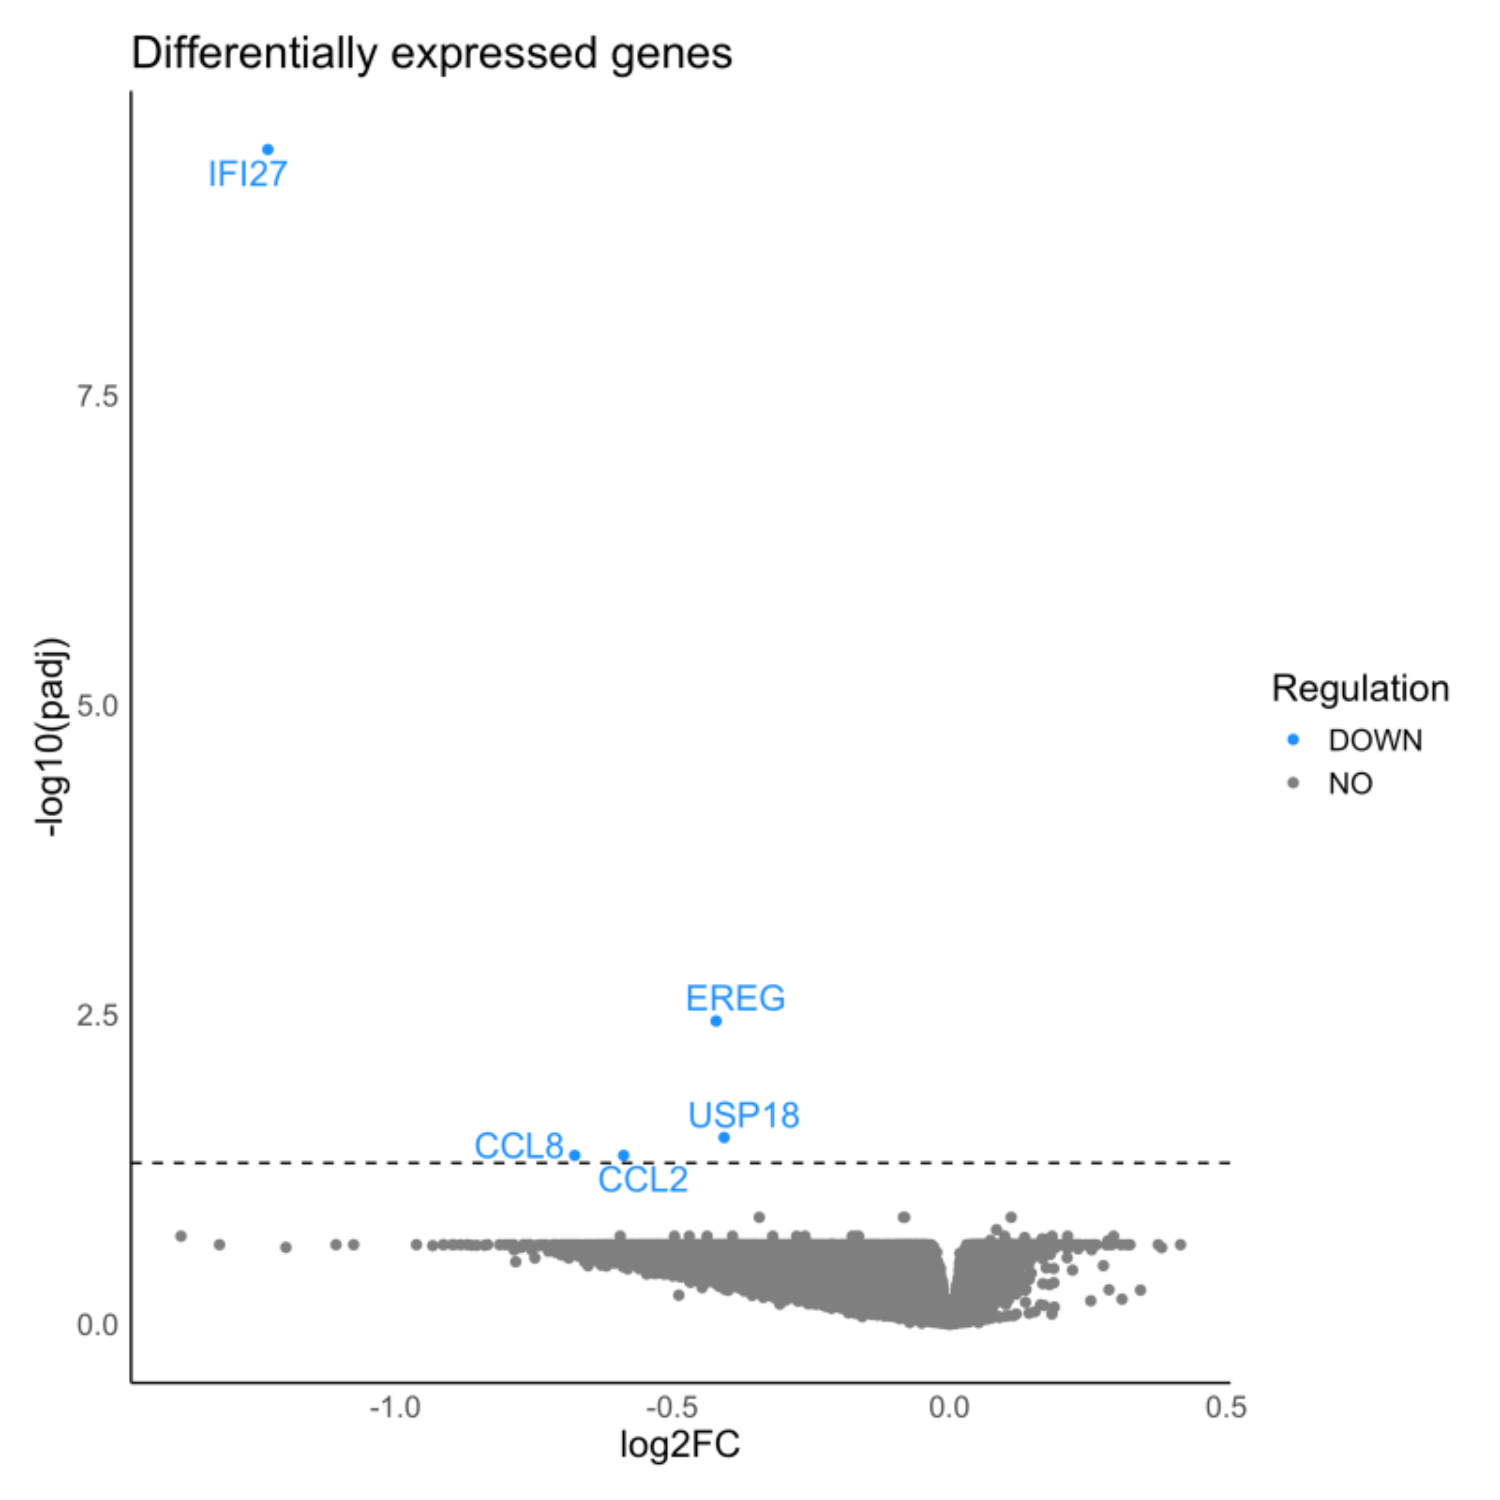
Volcano plot of dysregulated genes
References: Genolini, C., Alacoque, X., Sentenac, M., & Arnaud, C. (2015). kml and kml3d: R packages to cluster longitudinal data. Journal of statistical software, 65, 1-34.
Chang, C. C., Chow, C. C., Tellier, L. C., Vattikuti, S., Purcell, S. M., & Lee, J. J. (2015). Second-generation PLINK: rising to the challenge of larger and richer datasets. Gigascience, 4(1), s13742-015.
Ritchie, M. E., Phipson, B., Wu, D. I., Hu, Y., Law, C. W., Shi, W., & Smyth, G. K. (2015). limma powers differential expression analyses for RNA-sequencing and microarray studies. Nucleic acids research, 43(7), e47-e47.
Love, M. I., Huber, W., & Anders, S. (2014). Moderated estimation of fold change and dispersion for RNA-seq data with DESeq2. Genome biology, 15, 1-21.
To cite this abstract in AMA style:
M. Lai, S. Kulkarni, B. Benitez. Molecular Landscape of Gastrointestinal Dysfunctions in Parkinson’s Disease [abstract]. Mov Disord. 2024; 39 (suppl 1). https://www.mdsabstracts.org/abstract/molecular-landscape-of-gastrointestinal-dysfunctions-in-parkinsons-disease/. Accessed April 20, 2025.« Back to 2024 International Congress
MDS Abstracts - https://www.mdsabstracts.org/abstract/molecular-landscape-of-gastrointestinal-dysfunctions-in-parkinsons-disease/