Category: Ataxia
Objective: We aim to identify volume differences in the cerebellum between spinocerebellar ataxia type 1 (SCA1), SCA3, SCA6, multiple-system atrophy, cerebellar type (MSA-C), and sporadic adult-onset ataxia (SAOA).
Background: Cerebellar atrophy is a neurodegenerative hallmark in hereditary as well as sporadic ataxias. Hence, quantifying the volume of the cerebellum and its lobules is of great interest in particular since it may serve as a biomarker in interventional trials.
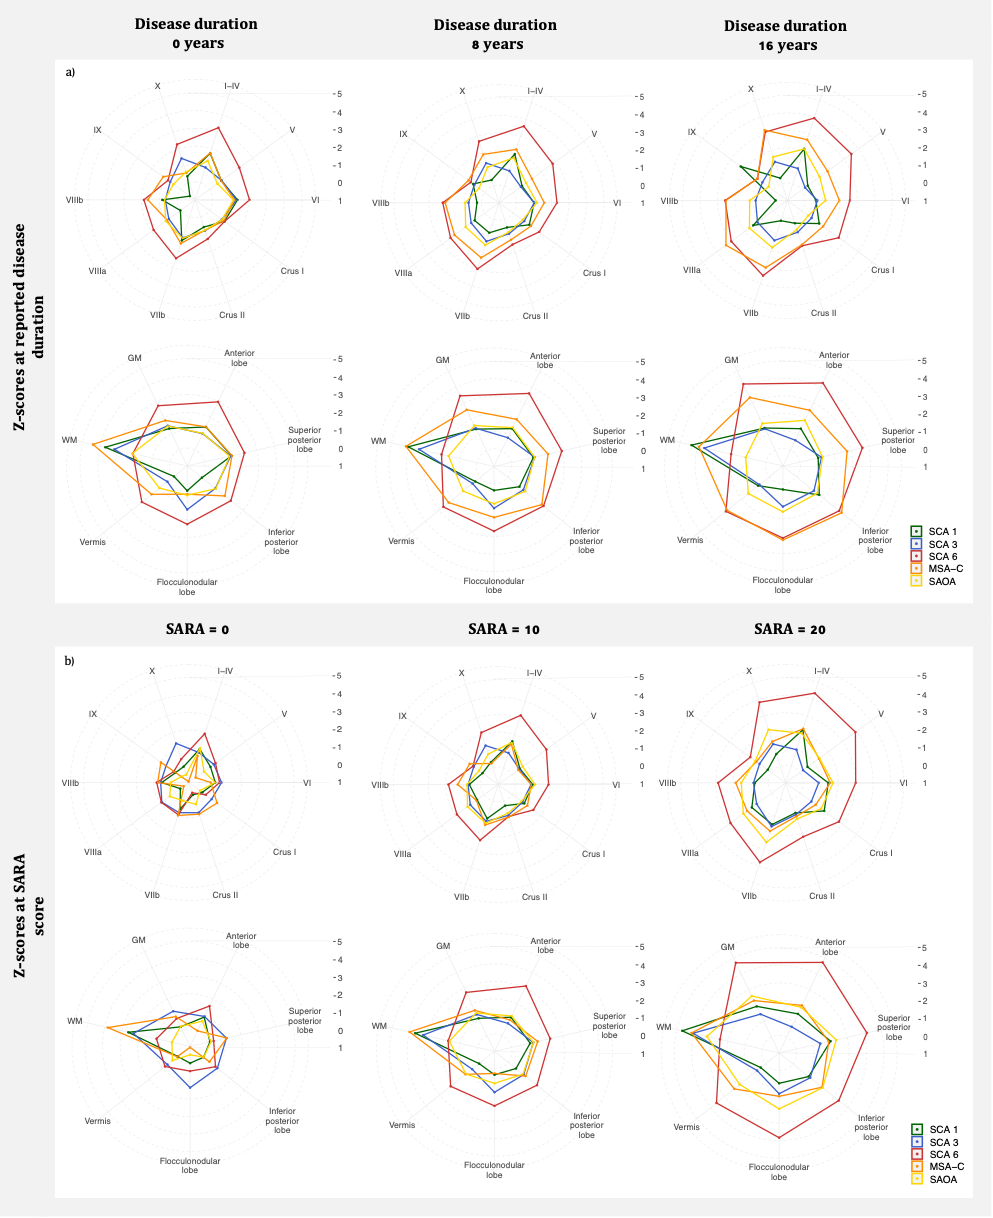
Method: We included mutation carriers of SCA1 (N=15), SCA3 (N=69), SCA6 (N=19), MSA-C (N=20), and SAOA (N=43), as well as healthy controls (HCs) (N=292). T1-weighted images were analyzed and cerebellar volumes were obtained using an in-house developed tool, CerebNet [1]. Each disease group was compared to an age- and sex-matched HC group via paired t-test. To compare the different volumes at certain time and severity levels, we performed a z-transformation and plotted z-scores against the reported disease duration and ataxia severity assessed with SARA. We plotted the intercept of the linear interpolation line at 0, 8 and 16 years of disease duration as well as the SARA sum score of 0, 10 and 20 to compare the degree of atrophy between diseases.
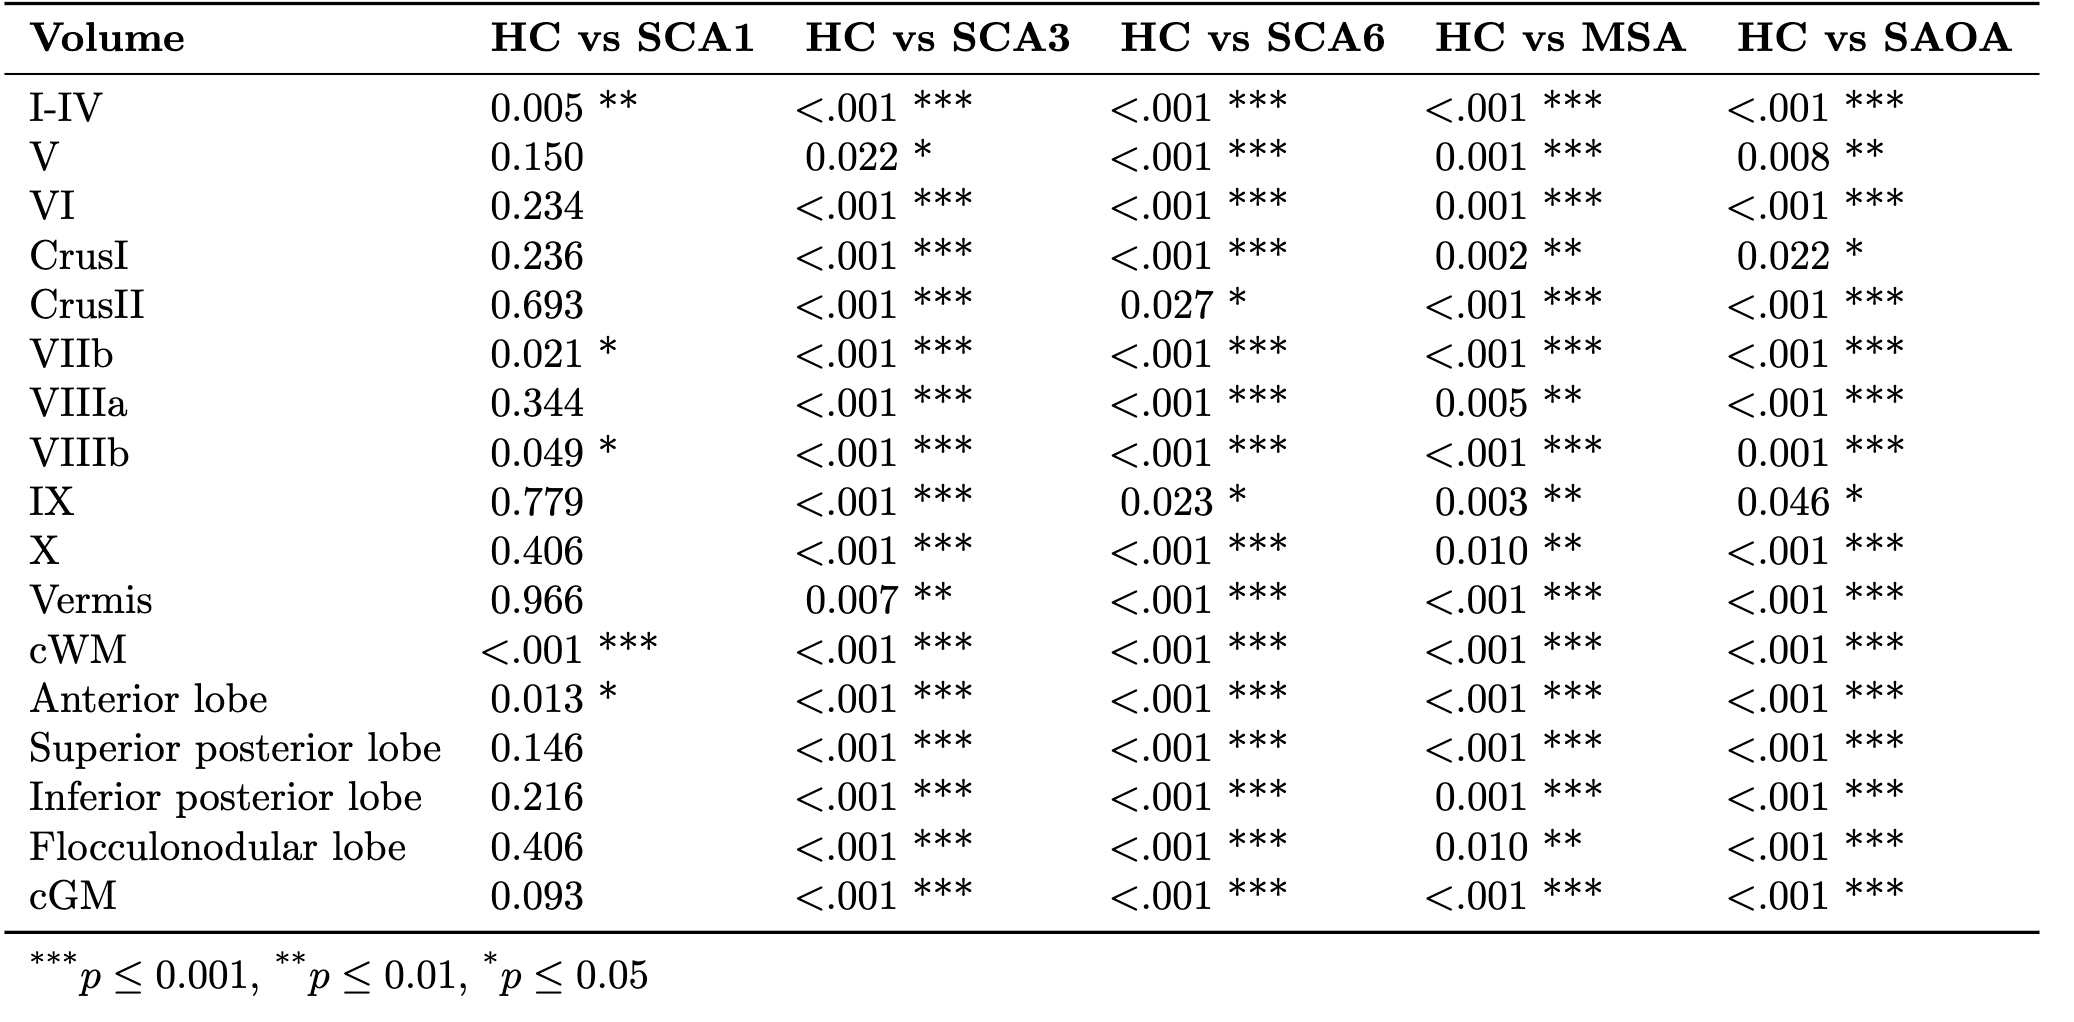
Results: Volume comparisons between HC and each disease group, except SCA1, showed significant differences for all regions. SCA1 showed a reduced volume in the lobules I-IV, VIIb, and VIIIB, as well as for the aggregated volumes anterior and inferior posterior lobes, and the cerebellar white matter ([table1]). When considering disease duration, the pattern of neurodegeneration was comparable for SCA1, SCA3, MSA-C and SAOA at the age of onset, while SCA6 showed the largest cerebellar atrophy up to 3 standard deviations below the age-related HC mean. However, related to ataxia severity the degree of atrophy was almost comparable for SCA1, 3, 6, and SAOA in grey matter volumes and much higher in MSA-C. In SCA6, the atrophy of cerebellar white matter over disease duration is constant ([figure1]).
Conclusion: We could identify atrophy of the cerebellum in SCA1, SCA3, SCA6, MSA-C as well as SAOA in comparison to HCs. Cerebellar atrophy was most pronounced in MSA-C and more closely related to ataxia severity than disease duration. Future work with higher numbers of participants will hopefully allow a more detailed delineation of cerebellar atrophy along the disease course and related to ataxia severity.
References: [1]Faber J, Kügler D, Bahrami E, Heinz LS, Timmann D, Ernst TM, Deike-Hofmann K, Klockgether T, van de Warrenburg B, van Gaalen J, Reetz K, Romanzetti S, Oz G, Joers JM, Diedrichsen J; ESMI MRI Study Group; Reuter M. CerebNet: A fast and reliable deep-learning pipeline for detailed cerebellum sub-segmentation. Neuroimage. 2022 Dec 1;264:119703. doi: 10.1016/j.neuroimage.2022.119703. Epub 2022 Oct 27. PMID: 36349595; PMCID: PMC9771831.
To cite this abstract in AMA style:
M. Ferreira, T. Schaprian, T. Klockgether, J. Faber. Cerebellar volumetry in SCA1, SCA3, SCA6, MSA-C, and SAOA [abstract]. Mov Disord. 2023; 38 (suppl 1). https://www.mdsabstracts.org/abstract/cerebellar-volumetry-in-sca1-sca3-sca6-msa-c-and-saoa/. Accessed April 26, 2025.« Back to 2023 International Congress
MDS Abstracts - https://www.mdsabstracts.org/abstract/cerebellar-volumetry-in-sca1-sca3-sca6-msa-c-and-saoa/


