Category: Surgical Therapy: Parkinson's Disease
Objective: To describe the location of stimulation fields as applied to optimized programming parameters in a cohort of STN DBS PD patients participating in INTREPID RCT using a new visualization software tool.
Background: Software tools have been developed to aid in DBS programming and may help streamline the process of determining optimal settings. Here we describe our experience applying a new visualization tool in subjects implanted with a new DBS system as part of the INTREPID Study.
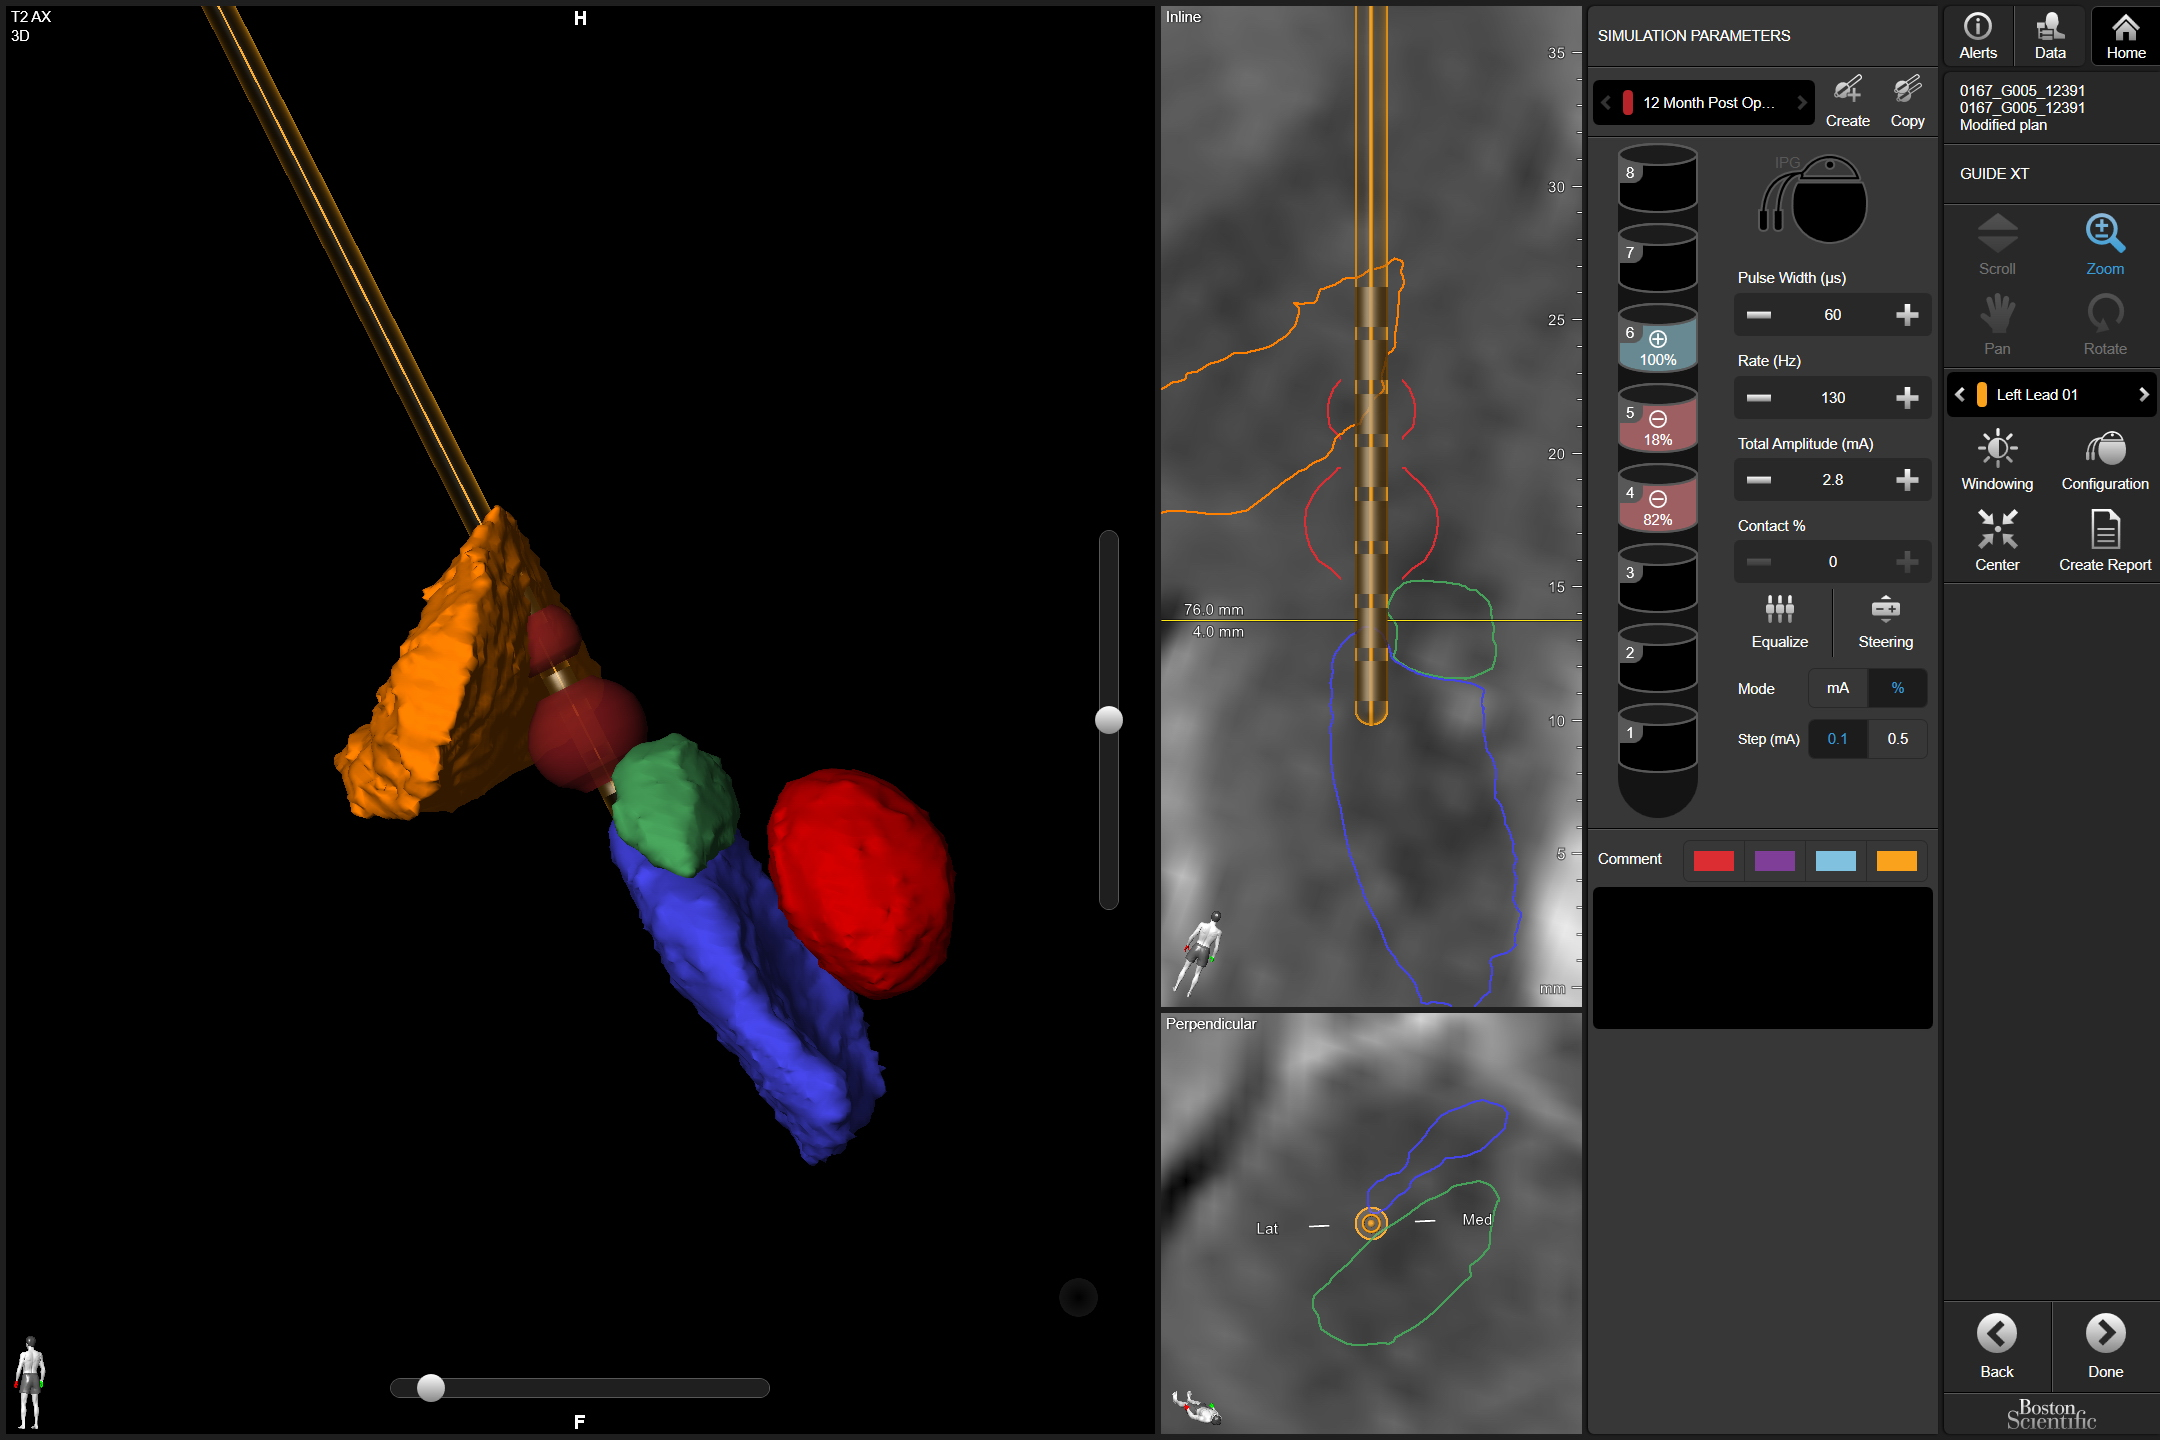
Method: Subjects in this sub-analysis were enrolled in a multi-center, prospective, double-blinded, sham control, RCT – INTREPID trial (sponsor Boston Scientific) and implanted bilaterally in the STN with a multiple-source, constant current DBS System (VERCISE) and 8 contact linear leads at Univ. of California San Francisco. The lead location and a 3D visualized area representative of the volume of tissue activated (VTA) in the neuroanatomical region of the stimulated electrodes were captured using a visualization tool (GUIDE XT, Boston Scientific) with chronic 1 year stimulation parameters. VTAs were classified as encompassing 1) Predominantly STN only, 2) STN and < 50% of VTA being dorsal to STN (including Zi), 3) STN and some SN with or without the area dorsal to the STN, or 4) STN, GPi, and area dorsal to the STN.
Results: At one year, 11 participants (7M/4F, mean age 60 yrs, disease duration 12.6 yrs) experienced a 57.6% reduction in LEED, and improvements in Off Med UPDRS III (48.9%), dyskinesia (77.9%), UPDRS III gait subscore (45.5%) and hemibody tremor (62.3%), rigidity (60.3%) and bradykinesia(48.1%) subscores. The analysis revealed all 22 VTA in the STN, 9 also included a VTA that was < 50% dorsal to STN (Zi), 10 were in the STN without or limited Zi VTA coverage, 20 VTAs included some SN, and 1 included some GPi VTA coverage. Despite the considerable variability in VTAs across subjects, most had marked improvement in motor scores and subscores. Interestingly, 5 VTAs included the internal capsule without clinical correlation.
Conclusion: Use of a visualization tool may provide useful visual feedback for clinical programming and offer the opportunity to understand the influence of the stimulation field on individual’s local STN regional anatomy. Considerable variability in VTAs in this relatively small cohort with similar clinical outcomes was noted.
To cite this abstract in AMA style:
P. Prakash, D. Romero, M. Volz, P. Starr, S. Wang, M. San Luciano, N. Galifianakis, R. Jain, J. Ostrem. Use of a new Stimulation Field Visualization Tool in Parkinson’s Disease Subjects Treated with Subthalamic Nucleus Deep Brain Stimulation (sub-analysis from INTREPID RCT) [abstract]. Mov Disord. 2020; 35 (suppl 1). https://www.mdsabstracts.org/abstract/use-of-a-new-stimulation-field-visualization-tool-in-parkinsons-disease-subjects-treated-with-subthalamic-nucleus-deep-brain-stimulation-sub-analysis-from-intrepid-rct/. Accessed December 23, 2025.« Back to MDS Virtual Congress 2020
MDS Abstracts - https://www.mdsabstracts.org/abstract/use-of-a-new-stimulation-field-visualization-tool-in-parkinsons-disease-subjects-treated-with-subthalamic-nucleus-deep-brain-stimulation-sub-analysis-from-intrepid-rct/

